Amplitude (seismic)
| Wiki Write-Off Entry | |
|---|---|

| |
| Student Chapter | University of Brawijaya |
| Competition | June 2015 |
Definition
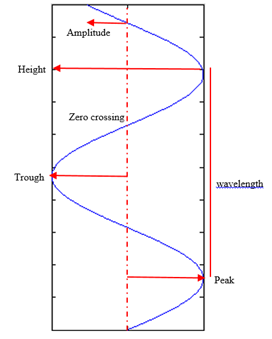
Amplitude is deviation of wave from zero crossing. Maximum positive amplitude is referred to peak and Maximum negative amplitude is referred to trough. The value of amplitude is equal to the value of seismic trace at specific depth. While, Seismic trace is parameter of seismic wave that represents contrast of acoustics impedance on the boundary of bedding rock on a geophone.[1]. Figure 1 show part of the wave:
From Acquisition to Seismic Trace
Seismic data acquisition is done by geophysicists where source is shot into subsurface. Then, the wave propagate and is reflected on rock boundary. After that, the wave that is reflected propagates with different path to surface and is recorded by geophone. The wave that is recorded is P wave. This wave consist of direct wave, reflected wave, refracted wave and noise. Amplitude that wants to be interpreted in oil and gas industry commonly is only reflected waves. Therefore, Geophysicists processing the data to reduce amplitude effect from another waves. The seismic data after processing can be classified to be post-stack and pre-stack data. Post-stack data analyze seismic data with zero offset amplitude, while pre-stack data analyze seismic data with non-zero offset amplitude.

Seismic Trace
Seismic trace is resulted by convolution of wavelet and reflection coefficient. Wavelet is wave that represents a seismic reflector that recorded by a geophone where every source has different character of wavelet. While, Reflection coefficient (RC) is parameter that represents geological model in the subsurface. The value of RC depend on contrast of impedance acoustic (IA) where contrast of IA is proportional to RC, RC is proportional to Seismic trace and Seismic trace at specific depth is equal with amplitude. Mathematically relation all parameters are expressed by equation below:
Seismic trace has some important parameters to data interpretation that is polarity and phase. There is 2 kind of wavelet phase which is used at seismic that is zero phase wavelet and minimum phase wavelet. Commonly zero phase wavelet is used to interpretation seismic data because the wavelet has highest S/N than other, maximum amplitude coincides with spike of reflection, and the pattern of wavelet is symmetry so picking horizon become easy.[3]
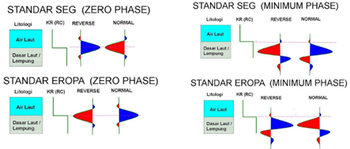
Wavelet polarity is divided to be 2 that is the Europe standard and SEG standard. Seismic data has Europe normal standard if the change of impedance acoustic from low to high will have positive amplitude. While, seismic data which has SEG normal standard if the change of impedance acoustic from low to high will have negative amplitude.
Determination polarity
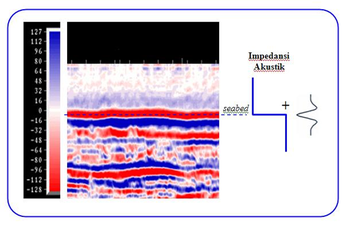
Polarity of seismic data is important parameter that must be known to interpretation seismic data where it can be known with studying character of seismic trace. When marine seismic data, the polarity is identified by reflector of sea water and seabed. The reflector appears from low to high AI, if red is negative amplitude and reflector between sea water and seabed is red. So, polarity is SEG Normal.[1]
Different trick is used to identify polarity of onshore seismic data. If target is carbonate or regional geology target has coal lithology. Polarity prediction can assume that Carbonate has strong AI than other lithology. That mean if carbonate contact to other lithology will show very strong amplitude because the contrast IA.is high. Picture below shows. If top carbonate has strong amplitude with red color amplitude. The change polarity of other lithology to top carbonate commonly from low to high IA, if red reflector is negative amplitude so polarity of this data is SEG normal.[1]
Tuning Effect
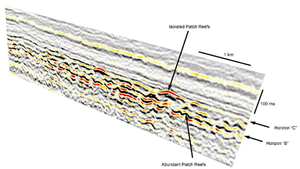
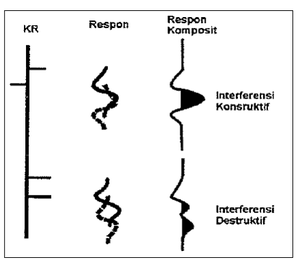
In many cases the amplitude of the seismic waves cannot represent the subsurface conditions. This is due to the vertical resolution of the seismic data. The vertical resolution is referred tuning thickness that is distance of 2 pieces in a vertical objects which can be distinguished by seismic waves. At this thickness, seismic amplitude is the amplitude of the interference from many amplitude so that some subsurface geological uniqueness is lost. Tuning effects caused reservoir thickness can be at peak or trough depends on the interference that occurs.[5] Tuning thickness equation is
-
- where λ = wavelength of wave
Factors That Influences Amplitude
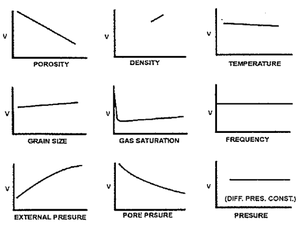
Factors that influences velocity of wave are porosity, density, temperature, grain size, gas saturation, frequency, external pressure, pore pressure and stress. The curve between P wave velocity and various parameters are shown in the figure below. The most influential factor on the P wave velocity changes include porosity, gas saturation, external pressure and pore pressure. The relationship between gas saturation and P wave velocity drops drastically resulting in the formation of anomalies such as DHI, AVO, and others.
Application
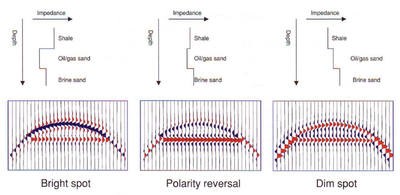
DHI is a seismic amplitude anomalies. DHI will appear when a seismic data has a high IA. There are three kind of DHI that is bright spot, polarity reversal and dim spot as shown in the figure below. Besides the three effects below are also indicated fluid contact with the flat spot zone as a result of contact fluid on seismic data.
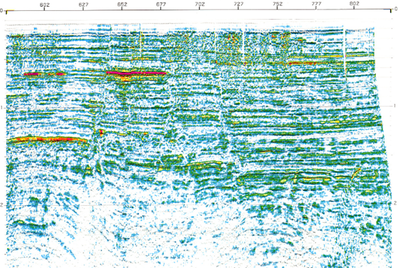
Attributes amplitude such as AVO, strong reflection, the variance is one example of an advanced interpretation used to perform reservoir characterization. The whole method is based on the basic concept of which the amplitude AVO study the amplitude variations of the offset to determine the distribution of fluid. Strong reflection calculate the square of the amplitude of real and imaginary in order to know the possibilities regions and variants studied reservoir uniformity of data where the data is not uniform can indicate patterns of fault.
Amplitude is a very important parameter to be observed. Studying deep about amplitude will provide much additional data that can be used when interpretation the seismic data. So let think big, start small.
References
- ↑ 1.0 1.1 1.2 1.3 1.4 Abdullah, A., 2007, Ensiklopedi Seismik
- ↑ Boyer, S. and Mari, J.L (1997). Seismic Surveying and Well Logging. Paris: Technip
- ↑ Sukmono , S. and Agus, A. (2001). Karakterisasi Reservoir Seismik. Bandung: Lab. Geofisika Reservoir ITB
- ↑ Boyer, S. and Mari, J.L (1997). Seismic Surveying and Well Logging. Paris: Technip
- ↑ Sukmono, S., and A. Agus, 2001, Karakterisasi Reservoir Seismik. Bandung: Lab. Geofisika Reservoir ITB.
- ↑ Posamentier, H., 2010, Patch Reefs in Seismic
- ↑ Hilterman, F. J., 2001, Seismic amplitude interpretation: short course notes. Distinguished Instructor Series no. 4. Society of Exploration Geophysicists, Tulsa, Oklahoma
- ↑ Bacon, M., R. Simm, and T. Redshaw, 2003, 3D Seismic Interpretation. Cambridge University Press, p. 126
- ↑ Taner, M. T and R. E. Sheriff, R.E. Application of Amplitude, Frequency, and Other Attributes to Stratigraphic and Hydrocarbon Determination, in Seismic Stratigraphy- Applications to Hydrocarbon Exploration, AAPG Memoir 26
