Borehole gravity applications: examples
| Exploring for Oil and Gas Traps | |

| |
| Series | Treatise in Petroleum Geology |
|---|---|
| Part | Predicting the occurrence of oil and gas traps |
| Chapter | Applying gravity in petroleum exploration |
| Author | David A. Chapin, Mark E. Ander |
| Link | Web page |
| Store | AAPG Store |
Distant reef exploration
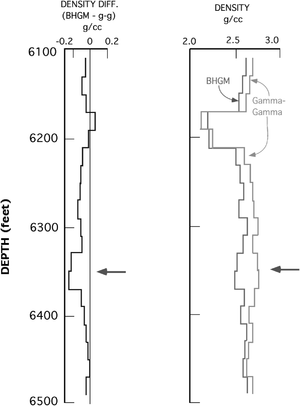
The broad departure between the BHGM and gamma-gamma density logs in this Michigan reef example reveals the edge of the reef complex is within a few hundred feet of the well. The overlying low-density zone near the top of the log is salt. The sharp difference in density at the arrow is caused by a remote higher porosity zone not detected by the gamma-gamma density log. The broader difference anomaly observed over the length of the interval is explained by the influence of the entire reef complex.
Figure 1 shows three logs. The log under the scale on the left is the difference between the BHGM density measurements and the gamma-gamma log density measurements. The logs under the scale on the right are the density values measured by the BHGM (left line) and the gamma-gamma tools (right line).
Salt body geometry
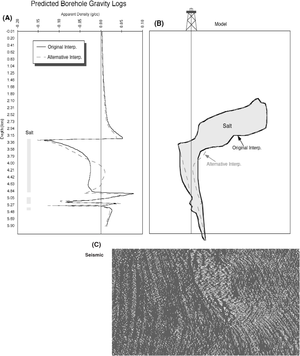
In many Gulf of Mexico prospects, salt plays a key role in acting as a structural trap. Overhanging salt often forms seals, and sediments on salt flanks can have structural and stratigraphic pinch-outs against the salt. The exact shape of the salt is critical in understanding these traps. Unfortunately, seismic imaging often tends to be poor in these prospects. In Figure 2's synthetic model (taken from a real structure), if a borehole gravity log were run, it would be able to tell conclusively which of the two seismic interpretations shown below in the figure was valid. Either interpretation would have a significant impact on the completion and economics of the exploration play. Figure 2(A) is predicted BHGM logs through a salt body in the Gulf of Mexico, 2(B) is a model of the salt body, and 2(C) is a seismic section through the salt body shown in the model (B).
Monitoring well drawdown
One of the most attractive aspects of borehole gravity applications is its ability to detect gas, oil, and water contacts at large distances from the borehole. It can do this through multiple casing strings and formation damage—conditions where the neutron density tool performs poorly. In many hydrocarbon reservoirs, the oil has a gas cap. Frequently, these reservoirs have an underlying water zone. The shape of these interfaces over time is critical to production strategy. Methods can determine where those contacts exist in the well-bore, but only borehole gravity can determine their shape away from the well. Because the interfaces are mobile with time, their movement can be monitored with borehole gravity.
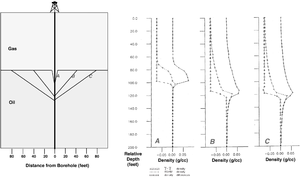
Figure 3 shows a synthetic model of the configuration of a theoretical drawdown gas cone around a producing well, modeled after the Prudhoe Bay field, Alaska. Since so little is known about the shape of gas coning, present logging methods can severely underestimate the true gas-oil contact in the reservoir away from wells. Borehole gravity can determine the shape of the gas cone as well as locate the true gas-oil contact at a distance from the producing wells. Logs A, B, and C correspond to different gas cones shown in the model.
Bypassed pays
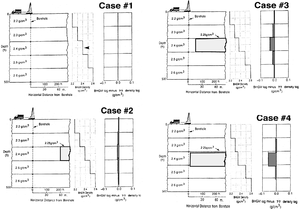
Because the borehole gravity meter is the only tool that can measure bulk density away from the borehole, it is ideal to use for finding bypassed pay zones. In Figure 4, Case #1 shows a model of laterally homogenous geology and no density anomalies. Case #2 shows a region of lower density, possibly signifying the presence of missed hydrocarbons length::60 m from the well. The density difference detects the distant density contrast as a broad, anomalous low with its minimum centered at the correct depth. Such a zone may be within range of a borehole sidetrack. In Case #3 the low-density missed pay zone is within length::15 m of the well, and a strong density difference exists. Such pay zones may be in the range of a possible well completion after hydrofracturing the reservoir. In Case #4 the missed pay is about length::1 m from the well, and the density difference is very pronounced. Such pay zones are within the range of normal well completions but would still be undetected by any other logging method.
These examples show that borehole gravity can indicate the presence of bypassed pay zones 1–60 m from the well. Once the well is cased, no other logging tool can do this. This is why the borehole gravity tool is currently the best technology available to search for bypassed hydrocarbons in existing wells.
Combining BHGM with tomography
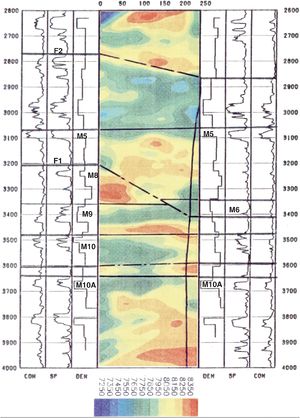
Between-well imaging jointly uses borehole gravity with seismic tomography. Because of the unique distant resolution capabilities of borehole gravity, these data provide a useful integrating tool at the seismic wavelet scale. In the Gulf of Mexico example shown in Figure 5, Amoco used its borehole gravity log to help interpret a detailed cross-borehole seismic tomography image. The two wells were located less than length::250 ft apart. Two faults, Fl and F2, are seen in both data sets, and excellent correlations are made of various sands labeled M5, M6, M8, M9, M10, and M10A. Note that the well on the left encountered more pay sands than the well on right. Also note that the M6 sand is missing in the well on the left. The between-well structural and stratigraphic changes in only length::250 ft can be understood by combining the interpretations of the two comparable distant imaging tools: borehole gravity and seismic tomography.
Monitoring gas production
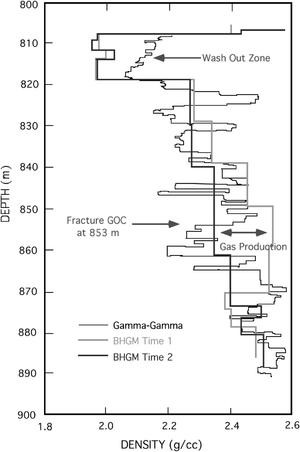
Figure 6 shows an example of a borehole gravity tool that succeeded where conventional open-hole and cased-hole logging methods had failed. In the upper part of the log, the gamma-gamma density log underestimates the gas saturation by about 15%. In the lower part of the log, wash-out zones are dominant, affecting the gamma-gamma log but not the BHGM log. Over these intervals, borehole gravity gives a more reliable and higher overall density measurement. The reservoir was fractured at length::853 m, and a normally tight reservoir started to produce gas. The second BHGM logging run shows the lower density of the fractured, gas-filled producing interval. Shallower than length::810 m, both gamma-gamma and BHGM logs agree. The borehole gravity tool was used to measure secondary gas saturation in a fractured limestone reservoir.
See also
- Borehole gravity methods
- Borehole gravity: uses, advantages, and disadvantages
- Borehole gravity tool
- Borehole gravity
References
- ↑ Rasmussen, N. F., 1975, The successful use of borehole gravity meter in northern Michigan: The Log Analyst, September-October, p. 1-10
- ↑ Beyer, L. A., 1991, Borehole gravity Surveys: SEG Short Course notes, June, 350 p. Excellent source for general principles of borehole gravity. Very good figures and references.
- ↑ Lines, L. R., H. Tan, and S. Treitel, 1991, Velocity and density imaging between boreholes: CSEG Recorder, vol. 16, no. 6, p. 9–14. A unique case study that integrates borehole gravity with the processing and interpretation of cross-well tomography.
- ↑ van Popta, J., J. M. T. Heywood, S. J. Adams, and D. R. Bostock, 1990, Use of borehole gravimetry for reservoir characterisation and fluid saturation monitoring: Expanded Abstracts, SPE Europec 90 conference, p. 151–160. Use of time-lapsed borehole gravity logging to monitor fluid movement away from the borehole.
