Buoyancy forces in reservoir fluids
| Oil Field Production Geology | |

| |
| Series | Memoirs |
|---|---|
| Part | The Production Geologist and the Reservoir |
| Chapter | Reservoir Fluids |
| Author | Mike Shepherd |
| Link | Web page |
| PDF file (requires access) | |
| Store | AAPG Store |
When hydrocarbons migrate into a trap, the buoyancy force exerted by the lighter oil (or gas) will push the water that was previously in the pore space sideways and downward. However, not all of the water is displaced; some of it will be held by capillary forces within the pores. Narrower capillaries, pores with smaller pore throats, hold onto water the strongest.
The two forces acting on the fluids in the pore space are controlled by physical laws. The equation for the buoyancy pressure is given by

where
- Pb is the buoyancy pressure;
- ρw and ρnw are the specific gravities of the wetting and nonwetting phases respectively;
- g is the acceleration of gravity; and
- h is the height above the free-water level.
The equation for capillary forces is given by

where
- Pc is the capillary pressure,
- sigma is the interfacial tension,
- theta is the contact angle between the wetting fluid and the solid surface, and
- r is the capillary (pore throat) radius[1]
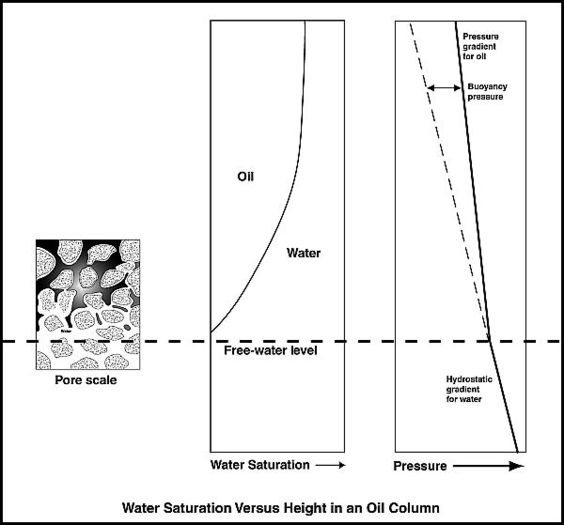
Figure 1 Water saturation decreases with height in an oil column. The volume of water is a function of the balance of capillary forces pulling the water up from the oil-water interface and the force of gravity acting together with the density contrast between the reservoir fluids, tending to pull the water down.
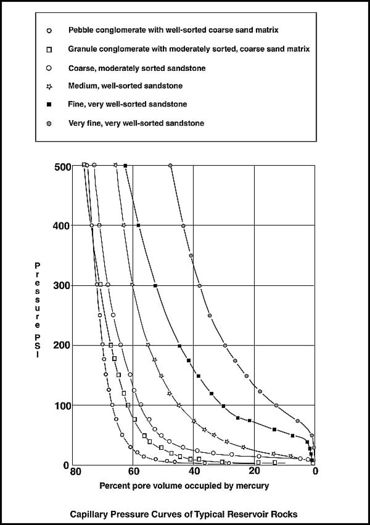
Figure 2 The shape of the curves on a capillary pressure plot reflects the grain sorting and the connection of pores and pore throats within the various rock types. The longer the plateau shown by the capillary curve, the better is the reservoir quality of the rock (from Sneider et al.[2] Reprinted with permission from the Society of Petroleum Engineers.


The volume of water remaining at a given height in a reservoir is a function of the balance of capillary forces pulling the water up from the hydrocarbon-water interface and the force of gravity acting together with the density contrast between the reservoir fluids, acting to pull the water down.[3] Thus, a given part of the pore space within the hydrocarbon leg can contain both hydrocarbons and water. The fraction (percentage) of water to total fluid volume is termed the water saturation.
For an oil field, the capillary-bound water comprises a continuous column of water within the oil leg, which will have a hydrostatic pressure gradient controlled by the water density. The oil is located in the remaining pore space as a continuous phase and will have a pressure gradient controlled by the (lower) oil density (Figure 1). Although oil and water can coexist in the same localized volume of rock, the pressures acting on the two fluids are different. The difference in pressure between the oil and water phases increases with height above the free-water level. The free-water level is the level at which the water-hydrocarbon interface would theoretically stand in a large open hole drilled through the oil column.[4] In this situation, only gravity and buoyancy forces control the fluid distribution in the borehole.
As the buoyancy pressure increases with height above the free-water level, the oil phase will displace more water from increasingly smaller pore volumes. The effect of this is that hydrocarbon saturations increase with height above the hydrocarbon-water contact. The relationship between capillary and buoyancy forces thus controls the static distribution of fluids in oil and gas pools. Knowledge of these relationships is fundamental to the accurate calculation of hydrocarbon volumes within a reservoir.
Capillary pressure is typically measured in the laboratory by injecting mercury under pressure into a core plug. The mercury is a nonwetting phase, which replicates the behavior of hydrocarbons in reservoir rocks. The procedure simulates the entry of hydrocarbons into a water-wet rock and the way in which buoyancy pressure increases with height in the hydrocarbon column.
Mercury will not enter the rock immediately. The pressure required to do this will depend on the radius of the pore throats, the contact angle, and the mercury-air interfacial tension. The pressure at which the mercury effectively enters the pore network is termed the displacement or entry pressure.[1] Lower entry pressures are found in the better quality reservoir rocks, that is, those with larger pore throat diameters. A cap rock with tiny capillaries, shale for instance, has a very high displacement pressure. The displacement pressure for a cap rock can be so high that the tightly bound water in the pore space of the shale will prevent the oil from entering and the oil remains trapped in the underlying reservoir rock.[5][4]
With increasing injection pressure, more and more mercury is forced into the rock. The shape of the curves on a capillary pressure plot reflects the grain sorting and the connection of pores and pore throats. The longer the plateau shown by the capillary curve, the better the reservoir quality. Poorly sorted, fine-grained sediment with narrow pore throats will retain water to higher pressures than coarser grained, better sorted sediments. A homogenous reservoir rock can be represented by a single capillary pressure curve. By contrast, a heterogenous reservoir will have a family of rock types, each with its own capillary pressure curve (Figure 2).
Petrophysicists will use capillary pressure curves as the basis for deriving a water saturation versus height relationship for a reservoir.[1]
References
- ↑ 1.0 1.1 1.2 Vavra, C. L., J. G. Kaldi, and R. M. Sneider, 1992, Geological applications of capillary pressure: A review: AAPG Bulletin, v. 76, no. 6, p. 840–850.
- ↑ Sneider, R. M., F. H. Richardson, D. D. Paynter, R. E. Eddy, and I. A. Wyant, 1977, Predicting reservoir rock geometry and continuity in Pennsylvanian reservoirs, Elk City, Oklahoma: Journal of Petroleum Technology, v. 29, no. 7, SPE Paper 6138, p. 851–866.
- ↑ Arps, J. J., 1964, Engineering concepts useful in oil finding: AAPG Bulletin, v. 48, no. 2, p. 157–165.
- ↑ 4.0 4.1 Schowalter, T. T., 1979, Mechanics of secondary hydrocarbon migration and entrapment: AAPG Bulletin, v. 63, no. 5, p. 723–760.
- ↑ Berg, R. R., 1975, Capillary pressures in stratigraphic traps: AAPG Bulletin, v. 59, no. 6, p. 939–956.
External links
| find literature about Buoyancy forces in reservoir fluids |