Core-to-log transformations and porosity-permeability relationships
| Development Geology Reference Manual | |

| |
| Series | Methods in Exploration |
|---|---|
| Part | Laboratory methods |
| Chapter | Core-log transformations and porosity-permeability relationships |
| Author | Walter A. Nagel1, Keith A. Byerley |
| Link | Web page |
| Store | AAPG Store |
Core-log transformations[edit]
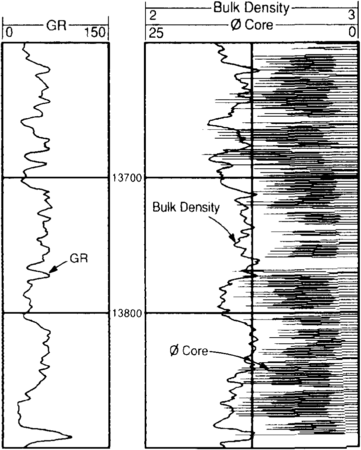
Figure 1 Plot showing unshifted core porosity in spiked format, together with bulk density log.
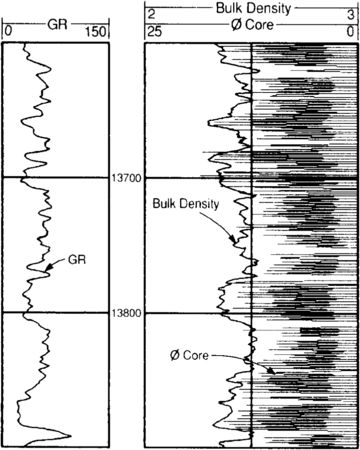
Figure 2 Plot showing shitted core porosity, together with bulk density log.
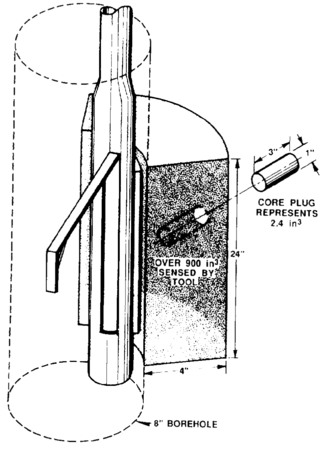
Figure 3 Comparison of the volume of formation measured by the bulk density tool relative to that obtained from a core plug.
Core and wireline log analysis provide the means for evaluation of reservoir potential. Proper core-to-log transformations are required to ensure that parameters used for quantitative log analysis are reasonable and that data from both sources are mutually supportive.
Depth control[edit]
Agreement between log depth and core depth is essential. Generally, core depths are adjusted relative to log depths. Core gamma ray is commonly used for depth control and can be of great assistance only if there is sufficient gamma ray activity in the core to provide precise boundaries. Should closely spaced core porosity measurements be available, a graphical approach can be taken. Figure 1 shows a technique in which measured core porosity is plotted together with the bulk density log. Core porosity is shown in a spiked form, with bulk density overlain as the continuous curve. The intervening no-data points have zero values. This spiked presentation offers a ragged edge that can be registered to the bulk density curve. The ragged edge offers more coherency to the eye than discrete points.
Figure 2 shows the same information after depth adjustments have been made. Depth registration to sharp lithology breaks, which are reflected in both log responses and core, should be used to confirm the shifts as previously determined. In addition, borehole image logs can provide excellent control for core depth and orientation. (For more on core-log depth adjustment, see Preprocessing of logging data.)
Spatial resolution[edit]
The spatial resolution of core information must be considered relative to that of the formation itself and to the vertical resolution and depth of investigation of the logging responses to be used in the analysis. Core has physical dimensions that can be discretely measured. Should the formation possess attributes that exceed these dimensions, precise prediction of those attributes cannot be expected. An example would be porosity obtained from 1-in-diameter core plugs taken from a conglomeratic reservoir, where the clast size can exceed length::6 in. or more. Any attempt to determine an average porosity from conventional core analysis would need to consider the sampling problem. In this case, it may be more appropriate to use information contained in the log responses for obtaining a true measure of porosity.
If one considers the zone of investigation of the formation density tool in an 8-in. borehole (Figure 3), the volume of rock seen by the tool encompasses roughly one quadrant, with a nominal penetration depth of length::4 in. and a thickness of length::24 in. This equates to more than 900 in.3 of material measured. When this is compared to a 1-in. core plug length::3 in. long, the log measures almost 400 times the volume measured by the plug.
Core samples will offer a sound representation of the formation when features of the rock are contained in the sample, as would be the case for a homogeneous sandstone. Even then, however, corrections may need to be applied to the core data, such as accounting for net overburden conditions.
When relating core information to log responses, one should be aware of the scale of measurement being used. It may be that independently derived log results are more accurate than either core analyses alone or transformations developed through core-to-log relationships.
Interpolation and filtering[edit]
Since core measurements are usually taken at irregular spacings, comparisons to regularly spaced log data require some scheme for infilling. This is usually accomplished through linear interpolation of porosity, density, and logarithm of permeability data. Decisions must be made regarding the distance that the interpreter is willing to accept for bridging no-data intervals, with data variability dictating the choice.
Once interpolated, the vertical resolution of the log and core measurements must be made comparable. Filtering the fine resolution of the core data to the coarser resolution of the log response is normally the route taken. The type of core sample—whether plug, sidewall, or whole core—must be balanced with the log measurement, each with its own vertical resolution. Filtering suppresses the detailed information available from core analyses. However, the objective is to move from small sample physical measurements (core) to relatively large sample remote measurements (logs) so as to make meaningful comparisons between the two data sources.
Core-to-log comparisons[edit]
Comparison of log results with those from core can take several forms, with overlay plots versus depth, crossplots, and histograms used most typically. Garner[1] and Wilson and Hensel[2] give several examples of overlay plots.
Porosity-permeability relationships[edit]
Porosity-permeability crossplots[edit]
Attempts are often made at finding a relationship between permeability (k) and porosity (ϕ) by making a semilog plot of these data from core (Figure 4). Such a relationship can permit permeability estimation over intervals where only core porosity or log porosity information is available. Such estimates of permeability based on regression against porosity alone can be extremely tenuous due to large scatter in the data. The method ignores other rock properties that also influence permeability. For carbonate reservoirs that may contain vugs and fractures, there is often no recognizable relationship.
Sometimes distinct k-ϕ trends can be hidden when rocks with different properties are lumped together. If it is possible to isolate core samples that have similar rock properties, apart from porosity, then k-ϕ relationships can be more readily observed (Figure 5). Often these statistical relationships are used to establish productive intervals via a porosity cutoff. For data in Figure 5, a minimum permeability of 1 md corresponds to a porosity cutoff of 5.3% in conglomerate and 10.7% in sandstone.
It should be pointed out that there is no theoretical justification for expecting a linear trend on semilog plots of k versus ϕ. In fact, the often-cited Kozeny equation (appropriate for describing porous media, such as filter packs, in which the grains are spherical, uniform in size, and unconsolidated) suggests that a log-log plot of k versus ϕ would be more appropriate.
In general, for a given porosity, the larger the grain size, the higher the permeability. This is illustrated in Figure 6, where porosity and permeability data from nonvuggy carbonate rocks have been segregated according to grain size.
When using porosity from core and logs, differences in these measurements must be taken into account. In theory, core measurements provide effective porosity because clay-bound water and nonconnected pores should be excluded in helium flow measurements. However, in practice, core heating (and even air drying) can collapse clays, resulting in a porosity that is higher than the effective porosity. Conversely, porosity obtained from neutron and density logs is total porosity, which includes bound water associated with clays, microporosity, and porosity from fractures and isolated vugs. Differences in these two porosity sources must be reconciled and accounted for when using porosity from logs and k-ϕ relationships based on core.
Permeability measured under simulated formation stress using formation brine is usually best. Routine air permeability data are almost always optimistic, particularly at low permeability. Correction for slip, net confining stress, and any rock-fluid interaction (should it exist) is necessary. The resulting permeability is the so-called absolute permeability, which applies to a single fluid occupying the pore space. When making comparisons with permeability derived from drill stem tests, where usually more than one fluid is present, relative permeability effects need to be considered. (For more on permeability factors and measurements, see Permeability.)
Multiple regression[edit]
In view of the previous discussion, it should be clear that porosity is just one of several rock properties that have an influence on permeability. To the extent that some of these other properties are contained in well log measurements, it seems reasonable to perform a multiple regression against all logs that may have permeability information associated with them. Wendt et al.[4] and Allen[5] have used multiple regression, together with log and core data, to predict permeability. It is important to realize that these empirical equations for permeability prediction should always be considered as local in nature. They should only be applied when rock characteristics match those of the control region.
Uncertainty in predictions[edit]
Prediction of permeability from well logs is far from an exact science. This is aggravated by the fact that ground truth is normally assumed to be core measurement—the accuracy of which varies significantly depending on procedure and how well samples represent the actual formation. To put the uncertainty in perspective, prediction of permeability within a factor of two of the true value is considered very good.
See also[edit]
- Core description
- Porosity
- Relative permeability
- Paleontology
- Wettability
- Oil and condensate analysis
- Capillary pressure
- Oilfield water analysis
- Permeability
- SEM, XRD, CL, and XF methods
- Thin section analysis
- Rock-water reaction: formation damage
- Overview of routine core analysis
References[edit]
- ↑ Garner, B. L., 1985, Case history of Cotton Valley Sand log interpretation for a North Louisiana field: Journal of Petroleum Technology, v. 37, n. 11, p. 1995–2005., 10., 2118/12182-PA
- ↑ Wilson, D. A., and W. M. Hensel, Jr., 1978, Computer log analysis plus core analysis equals improved formation evaluation in West Howard-Glasscock Unit: Journal of Petroleum Technology, v. 30, p. 43–51, 10, 2118/6188-PA
- ↑ Lucia, F. J., 1983, Petrophysical parameters estimated from visual descriptions of carbonate rocks—a field classification of carbonate pore space: Journal of Petroleum Technology, v. 35, p. 629–637., 10., 2118/10073-PA
- ↑ Wendt, W. A., S. Sakurai, and P. H. Nelson, 1986, Permeability prediction from well logs using multiple regression, in L. W. Lake, and Carroll, Jr., eds., Reservoir Characterization: Orlando, FL, Academic Press, 659 p.
- ↑ Allen, J. R., 1979, Prediction of permeability from logs using multiple regression: Transactions of the Sixth European Formation Evaluation Symposium, London, Paper M.
External links[edit]
| find literature about Core-to-log transformations and porosity-permeability relationships |