Core description
| Development Geology Reference Manual | |

| |
| Series | Methods in Exploration |
|---|---|
| Part | Laboratory methods |
| Chapter | Core description |
| Author | Frank G. Ethridge |
| Link | Web page |
| Store | AAPG Store |

Careful examination and recording of information from continuous cores provide critical data for stratigraphic correlation, environmental interpretation, and wireline log calibration. Core plugs provide samples for analysis of porosity, permeability, fluid saturation, and a host of compositional and textural studies. Recommendations for the well site and laboratory handling of cores as well as sedimentological analyses are described by Siemers et al.[2] and Miall.[3]
Advantages of core
Continuous cores have some advantages over outcrop exposures for environmental interpretation.[4] These advantages include the following:
- Not limited to stratigraphic unit outcrop positions
- Often provide a more complete section of the stratigraphic unit
- Better preservation of contacts between units having significantly different resistances to weathering
- Better preservation of delicate primary and soft sediment deformation structures in shale and siltstone units
- Better preservation of trace fossils
- Ability to obtain material for petrographic study below the present groundwater table
- Allow comparison of lithologic properties with petrophysical properties and wireline log responses.
These advantages, however, are offset by the lack of a three-dimensional view and the inability to observe lateral facies changes and large-scale sedimentary features directly.
Format for core logging

A graphic log format, which visually expresses a stratigraphic succession, is strongly recommended for describing continuous cores. Such logs should reflect the following:
- Thickness
- Grain size
- Sedimentary structures
- Accessories, such as fossils and diagenetic features
- Lithologies and nature of contacts between different lithologies
- Textural maturity
- Oil staining
- Fracturing
- Porosity
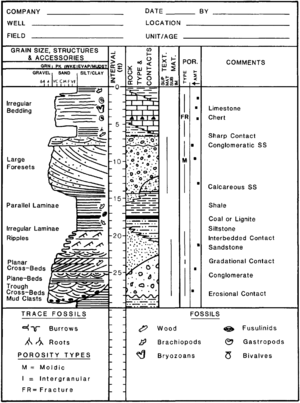
Recommended formats for graphic logging are given by Bebout and Loucks[8] and Boyles et al.[7] A completed graphic log is shown in Figure 1. Grain size, sedimentary structures, and accessories are shown in the left column. Let's look at how each type of data is handled in the graphic log.
Grain size
Terrigenous clastic grain sizes and carbonate rock types are recorded as a continuous vertical curve reflecting changes in depositional energy. Note that grain size increases to the left, as is inferred in the case of spontaneous potential (SP) and gamma ray curves. Grain size is determined by comparison with a chart made of sized sedimentary material or a visual pattern such as that produced by Amstrat. A good qualify handlens or reflecting light binocular microscope are essential for accurate grain size determination.
Sedimentary structures
Sedimentary structures are recorded to the right of and just inside the grain size curve. There is no single set of standardized symbols for sedimentary structures. Examples are given in Swanson[9] and Bebout and Loucks.[8] Realistic sketches of observed structures may be more useful than standard symbols. The vertical succession of sedimentary structures should be recorded as accurately as possible because this succession is often the key to successful environmental interpretation. Description, classification, and interpretation of sedimentary structures are discussed by Collinson and Thompson[10] and Lindholm.[11]
Accessories
Fossils, trace fossils, diagenetic and structural features, and other accessories are shown on the far right side of the left column of a graphic log. Standard symbols for these features are found in Swanson[9] and Bebout and Loucks.[8]
Thickness
Thicknesses are recorded in the column labeled “Interval.” A scale showing sufficient details of sedimentary structures and accessories for inferring environments is necessary. Boyles et al.[7] suggested that the smallest feature shown should be approximately length::0.05 in (1.3 mm) high. Usually a scale of length::1 in = length::5 ft or length::10 ft is appropriate.
Lithology
Dominant lithologies and the nature of the contact between lithologic units are recorded in the “Rock Type and Contacts” column near the middle of a graphic log (Figure 1). Standardized symbols for illustrating lithologies are available and are presented by Tucker[12] and Lindholm.[11] If more than one lithology or interbedded lithologies exist within an interval, lithologies should be logged by estimating the percent volume of each lithology and noting the terrigenous clastic lithologies to the left of the chemical rocks. Contacts between lithologies are recognized in core as gradational, interbedded, or sharp. Some sharp contacts are probably erosional and may represent unconformity surfaces. Additional information such as the presence of root structures and early diagenetic cements may aid in determining the true nature of sharp contacts.
Maturity
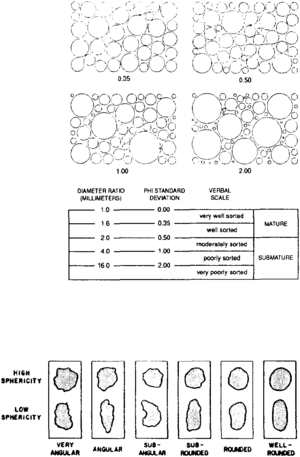
Textural maturity of sandstone units is recorded in the next column to the right (“Textural Maturity” in Figure 1) and is described following the method outlined by Folk.[15] Detrital clay (matrix) content and the sorting and roundness of grains are all considered in the determination of textural maturity. Because it is difficult to estimate the relative abundance of detrital versus authigenic clay without thin section or scanning electron microscope data, care must be taken in making estimates of detrital clay content. Image charts can be used for estimating sorting and roundness (Figure 2).
Porosity
Identification of porosity type and a qualitative estimate of porosity abundance should be made in the column labeled “Porosity.” For carbonate rocks, the porosity classification scheme discussed by Choquette and Pray[16] is recommended. For siliciclastic rocks, four types of porosity are common:
Of these, microporosity is the most difficult to recognize with a binocular microscope. The existence of microporosity is suggested by the presence of detrital or authigenic clays in sandstones. Accurate laboratory or thin section determinations of porosity types and percentages should always augment the estimates made during core logging. (For more on porosity classification schemes, see Porosity.)
Comments
Information not recorded elsewhere on the form can be included in the “Comments” column on the far right (Figure 1). Such items as color, presence of hydrocarbon residue, and inferred depositional environment can be placed here. Color should be determined using the standard color chart distributed by the Geological Society of America.[18]
Rock-log calibration
In most basins, few intervals in only a small number of wells are cored. Thus, calibrating of rock information (from continuous cores, closely spaced sidewall cores, or cuttings) to wireline log responses is essential to interpretation of depositional environments from logs alone. (For details of correlating cores to logs, see Preprocessing of logging data and Core-log transformations and porosity-permeability relationships. For information on interpreting depositional environments from logs, see Lithology from logs.)
See also
- Overview of routine core analysis
- SEM, XRD, CL, and XF methods
- Thin section analysis
- Conventional coring
- Core alteration and preservation
- Core handling
- Core orientation
References
- ↑ Ruppel, Stephen C., 2012, Appendix 3, in S. C. Ruppel, ed., Anatomy of a giant carbonate reservoir: Fullerton Clear Fork (Lower Permian) field, Permian Basin, Texas: AAPG Studies in Geology 63, unnumbered.
- ↑ Siemers, C. T., R. W. Tillman, and C. R. Williamson, eds., 1981, Deep-water clastic sediments—a core workshop: SEPM Core Workshop, n. 2, 416 p.
- ↑ Maness, M., and J. G. W. Price, 1977, Well formation characterization by residual hydrocarbon analysis: Annual Meeting of the Society of Petroleum Engineers, Denver, CO, Oct. 9–12, SPE 6860.
- ↑ Weimer, R. J., and R. W. Tillman, 1980, Tectonic influence on deltaic shoreline facies, Fox Hills Sandstone, west-central Denver basin: Colorado School of Mines Professional Contribution, n. 10, 131 p.
- ↑ Dunham, R. J., 1962, Classification of carbonate rocks according to depositional texture, in W. E. Ham, ed., Classification of Carbonate Rocks: AAPG Memoir 1, p. 108–121.
- ↑ Casey, J. M., 1980, Depositional systems and basin evolution of the Late Paleozoic Taos trough, northern New Mexico: Ph. D. Dissertation, The University of Texas at Austin, 236 p.
- ↑ 7.0 7.1 7.2 Boyles, J. M., A. J. Scott, and J. M. Rine, 1986, A logging form for graphic descriptions of core and outcrop: Journal of Sedimentary Petrology, v. 56, p. 567–568., 10., 1306/212F89DB-2B24-11D7-8648000102C1865D
- ↑ 8.0 8.1 8.2 Bebout, D. G., and R. G. Loucks, 1984, Handbook for Logging Carbonate Rocks: The University of Texas at Austin, Bureau of Economic Geology Handbook 5, 43 p.
- ↑ 9.0 9.1 Swanson, B. F., 1981, A simple correlation between permeabilities and mercury capillary pressures: Journal Petroleum Technology, v. 33, p. 2498–2504., 10., 2118/8234-PA
- ↑ Collinson, J. D., and B. D. Thompson, 1989, Sedimentary Structures: Boston, MA, Unwin Hyman, 207 p.
- ↑ 11.0 11.1 Lindholm, R. C., 1987, A Practical Approach to Sedimentology: Boston, MA, Allen and Unwin, 276 p.
- ↑ Tucker, M. E., 1982, The Field Description of Sedimentary Rocks: United Kingdom, The Open University Press, 112 p.
- ↑ Pettijohn, F. J., P. E. Porter, and R. Siever, 1987, Sand and Sandstone, 2nd. ed.: New York, Springer-Verlag, 553 p.
- ↑ Powers, M. C., 1953, A new roundness scale for sedimentary particles: Journal Sedimentary Petrology, v. 23, p. 117–119.
- ↑ Folk, R. L., 1974, Petrology of Sedimentary Rocks: Austin, TX, Hemphill Publishers, 159 p.
- ↑ Choquette, P. W., and L. C. Pray, 1970, Geological nomenclature and classification of porosity in sedimentary carbonates: AAPG Bulletin, v. 54, p. 207–250.
- ↑ Pitman, E. D., 1979, Porosity, diagenesis, and productive capability of sandstone reservoirs, in P. A. Scholle, and P. R. Schluger, eds., Aspects of Diagenesis: Society Economic Paleontologists and Mineralogists Special Publication 26, p. 159-173
- ↑ Goddard, E. N., 1979, Rock-Color Chart: Boulder, CO, Geological Society of America.
