Facies map
| Exploring for Oil and Gas Traps | |

| |
| Series | Treatise in Petroleum Geology |
|---|---|
| Part | Critical elements of the petroleum system |
| Chapter | Sedimentary basin analysis |
| Author | John M. Armentrout |
| Link | Web page |
| Store | AAPG Store |

Purpose and procedure
The purpose of a facies map is to reconstruct paleogeography, from which we can predict reservoir, seal, and source rock distribution. Facies maps are made at an isochronous surface or within a coeval interval.[2][3] We map reservoir system thickness (1) to compare the distribution of reservoir-system thickness and field location and (2) to identify or predict locations with thick reservoirs and trapping conditions that are undrilled. A procedure for mapping facies is outlined below:
- Identify and correlate significant isochronous surfaces throughout the depocenter, integrating well data, bioevents, and seismic reflection profile grids.
- Map areas of potential reservoir and seal facies that occur between two isochronous surfaces.
- Map seismic facies associated with that interval.
- Plot important physiographic features, such as the shelf-slope break or structurally controlled bathymetric highs.
- Integrate all data into a depositional facies map.
Seismic facies profile
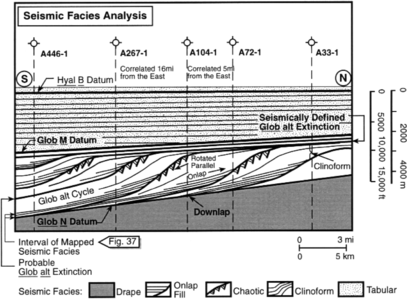
Figure 1 Interpreted seismic facies pattern for part of one seismic reflection profile down the axis of the High Island-East Breaks depocenter. After Armentrout.[4] Copyright: Gulf Coast SEPM.
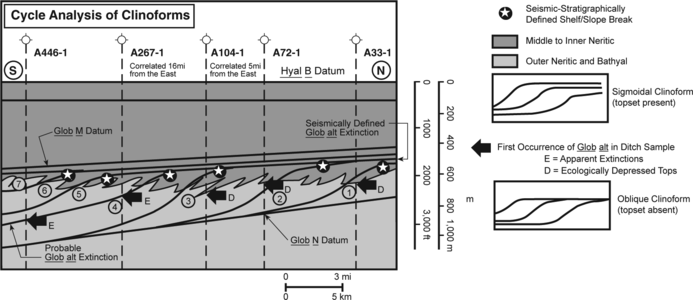
Figure 2 Seismic reflection profile schematic. From Armentrout;[4] courtesy Gulf Coast SEPM.
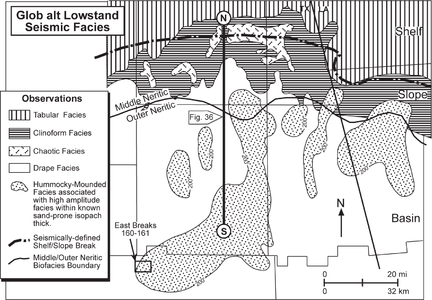
Figure 4 Map of the seismic facies of Glob alt low stand interval.
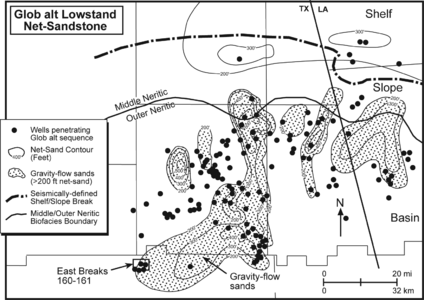
Figure 5 Net sand distribution of shelf areas contoured parallel to the shelf edge and slope areas contoured parallel to the depositional dip of the slope valleys down which the sand was transported.


Figure 1 is the interpreted seismic facies pattern for part of one seismic reflection profile down the axis of the High Island-East Breaks depocenter.[5] This is the same seismic profile shown in Figure 2.
Each prograding clinoform contains a rotated package of chaotic facies within the upper and steepest part of the clinoform facies and basinward of the tabular facies. The clinoform facies is onlapped by parallel, moderate-amplitude, onlapping reflections of the onlap-fill facies, which are subsequently downlapped onto by the next overlying prograding clinoform. In a broader sense, the drape facies below these clinoforms and the Glob N datum represent basinal deposits; the clinoform and onlapping-fill facies represent slope deposits; and the overlying tabular facies above the clinoforms and the Glob M datum represent shelf deposits—all part of a basin-filling succession.
Associated foraminiferal biofacies shown in Figure 2 and Figure 3 support this analysis. The Glob alt sequence is the fourth clinoform from the right, the fourth-most basinward of five oblique clinoforms that toplap along a common horizon. Superjacent clinoforms show progressively more topset deposition forming sigmoidal clinoforms, suggesting relative rise of sea level (with consistent widespread increase in accommodation space). Observations of seismic facies from a single phase of deposition, such as lowstand or highstand, are recorded on a map and contoured to convey the distribution of each seismic facies (Figures 4 and 5).
Seismic facies map
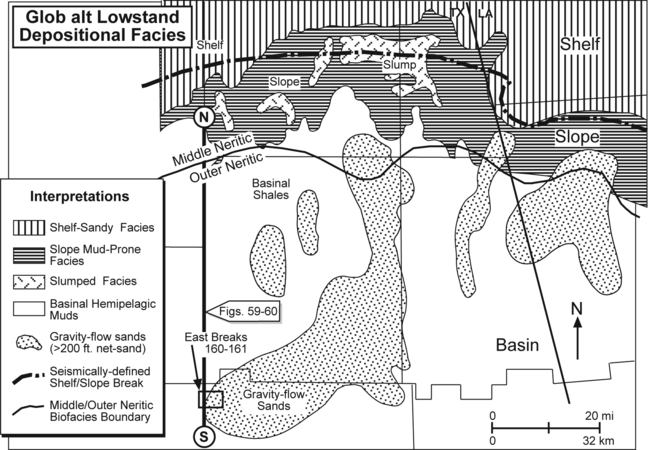
Figure 7 An integrated data base for interpreting depositional environments. After Armentrout.[5] Copyright: Springer-Verlag.


Figure 4 is a map of the seismic facies of the Glob alt lowstand interval (Figures 3 and 6). The mapped facies are observed in the interval immediately above the sequence boundary at the base of the Glob alt sequence in Figure 1. In the basin setting, the sequence boundary is, at seismic scale, essentially coincident with the underlying condensed section. The mapped facies are within the lowstand systems tract. Each observed facies is plotted along the transect of the seismic reflection profile, profile by profile. The area of shelf/slope inflection is plotted, based on the location of the inflection point between foreset and topset elements of the clinoform. Biofacies information (Figure 3) and sediment type (Figure 5) can then be overlain on the seismic facies map to provide an integrated data base for interpreting depositional environments (Figure 7).
Net sand map
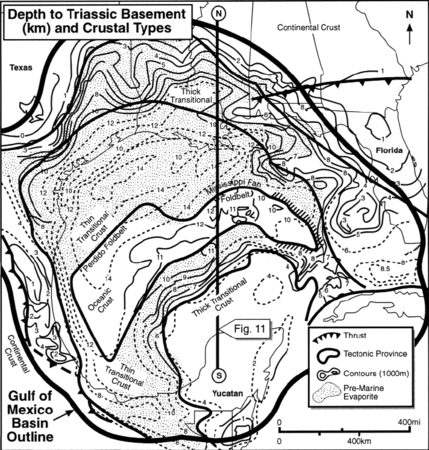
Figure 8 Tectonic map of the GOM basin. Modified from Buffler;[7] courtesy New Orleans Geological Society.
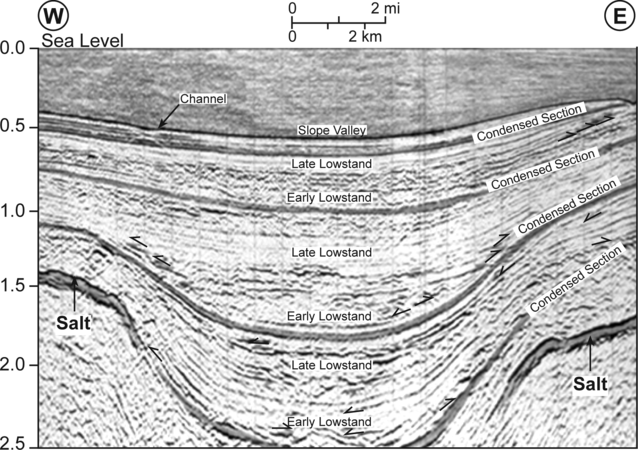
Figure 9 Depositional strike seismic reflection profile across a valley.


Of the 240 wells used in the study area, 147 penetrated the Glob alt interval and provided information on the distribution of the net sand deposited within that interval. Using the net-sand values from the wells, we integrate the data with seismic facies maps within the Glob alt lowstand isochron and contour a net-sand isopach map (Figure 5). Contours are for areas with at least length::200 ft (60 m) of net sand. The sandstones occur mostly seaward of the age-equivalent physiographic shelf/slope break identified on the seismic reflection profiles. Because most of the wells penetrated the Glob alt sequence basinward of the Glob alt shelf edge, the sandstones penetrated were most likely transported by gravity flow processes and deposited in environments on the slope and within intraslope basins.
The resulting map shows the net-sand distribution of shelf areas contoured parallel to the shelf edge and slope areas contoured parallel to the depositional dip of the slope valleys down which the sand was transported. The distribution of sand within the depositional dip-oriented isopachs is consistent with the regional pattern of downslope-oriented salt withdrawal valleys bounded by salt-cored anticlines (Figures 8 and 9). Note the lowstand position of the middle-to-outer neritic biofacies boundary, below which few waves reach the sea floor. This results in downslope sand distribution being controlled by bottom currents alone.
Depositional facies map
The figure below is a depositional facies map for the Glob alt interval's basal sequence boundary, constructed by integrating the biofacies map, the net sandstone map, and the seismic facies map (Figures 3, 5, and 4, respectively).
The upper slope deposits consist of the clinoform facies and numerous areas of chaotic facies, including rotated-block packages deposited in middle neritic to upper bathyal water depths (Figures 1, 4). The shelf facies consist of a thin interval of tabular facies representing a mixed system of inner-to-middle neritic deposits, nonmarine coastal-plain deposits, and the erosional surface at the Glob alt sequence boundary. The basinal deposits consist of the drape and onlap-fill facies of bathyal hemipelagic mudstone that encase the sandstone-prone mounded facies of sediment gravity flow origin, indicated here by the > length::200 ft (> 60 m) sandstone isopach. The gravity flow sandstones were deposited within slope valleys basinward of the physiographic shelf/slope break in deep middle neritic and deeper-water environments during falling and lowstand of sea level. The physiographic shelf/slope break is identified by the inflection point between the foreset and the topset reflections of the clinoform.
See also
References
- ↑ Masetti, D., R. Fantoni, R. Romano, D. Sartorio, and E. Trevisani, Tectonostratigraphic evolution of the Jurassic extensional basins of the eastern southern Alps and Adriatic foreland based on an integrated study of surface and subsurface data: AAPG Bulletin, v. 96, no. 11, p. 2065-2089.
- ↑ Tearpock, D. J., and R. E. Bischke, 1991, Applied Subsurface Geologic Mapping: Prentice-Hall, 648 p.
- ↑ Visher, G. S., 1984, Exploration Stratigraphy: Tulsa, PennWell Books, 334 p.
- ↑ 4.0 4.1 Armentrout, J. M., 1987, Integration of biostratigraphy and seismic stratigraphy: Pliocene–Pleistocene, Gulf of Mexico: Proceedings, Gulf Coast Section SEPM 8th Annual Research Conference, p. 6–14.
- ↑ 5.0 5.1 5.2 5.3 Armentrout, J. M., 1991, Paleontological constraints on depositional modeling: examples of integration of biostratigraphy and seismic stratigraphy, Pliocene–Pleistocene, Gulf of Mexico, in Weimer, P., and M. H. Link, eds., Seismic Facies and Sedimentary Processes of Submarine Fans and Turbidite Systems: New York, Springer-Verlag, p. 137–170.
- ↑ 6.0 6.1 Armentrout, J. M., 1996, High-resolution sequence biostratigraphy: examples from the Gulf of Mexico Plio–Pleistocene, in J. Howell, and J. Aiken, eds., High Resolution Sequence stratigraphy: Innovations and Applications: The Geological Society of London Special Publication 104, p. 65–86.
- ↑ Buffler, R. T., 1991, Early evolution of the Gulf of Mexico basin, in D. Goldthwaite, ed., An Introduction to Central Gulf Coast Geology: New Orleans Geological Society, p. 1–16.
External links
| find literature about Facies map |