File:AlfraihAlSaifFigure5.jpg
AlfraihAlSaifFigure5.jpg (405 × 74 pixels, file size: 11 KB, MIME type: image/jpeg)
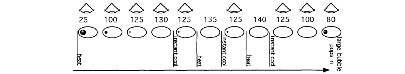
Schematic representation of expected behavior of fluid inclusions during cycling to determine homogenization temperature. Symbols above indicate when the inclusionist should be straining to see the bubble. Numbers are hypothetical temperatures in °C. Arrow indicates the progression of time during the cycling run. The inclusion had definitely homogenized by 140°C, because once that temperature had been reached, the inclu. sions had to be undercooled to 80°C for the bubble to renucleate. Thus, the run indicates the homogenization temperature took place between 135 and 140°C.
File history
Click on a date/time to view the file as it appeared at that time.
| Date/Time | Thumbnail | Dimensions | User | Comment | |
|---|---|---|---|---|---|
| current | 19:13, 31 January 2022 | 405 × 74 (11 KB) | Molyneux (talk | contribs) | Schematic representation of expected behavior of fluid inclusions during cycling to determine homogenization temperature. Symbols above indicate when the inclusionist should be straining to see the bubble. Numbers are hypothetical temperatures in °C. ... |
You cannot overwrite this file.
File usage
The following page uses this file: