File:Evaluating-structurally-complex-reservoirs fig1.png
Jump to navigation
Jump to search

Size of this preview: 800 × 483 pixels. Other resolutions: 320 × 193 pixels | 1,933 × 1,167 pixels.
Original file (1,933 × 1,167 pixels, file size: 174 KB, MIME type: image/png)
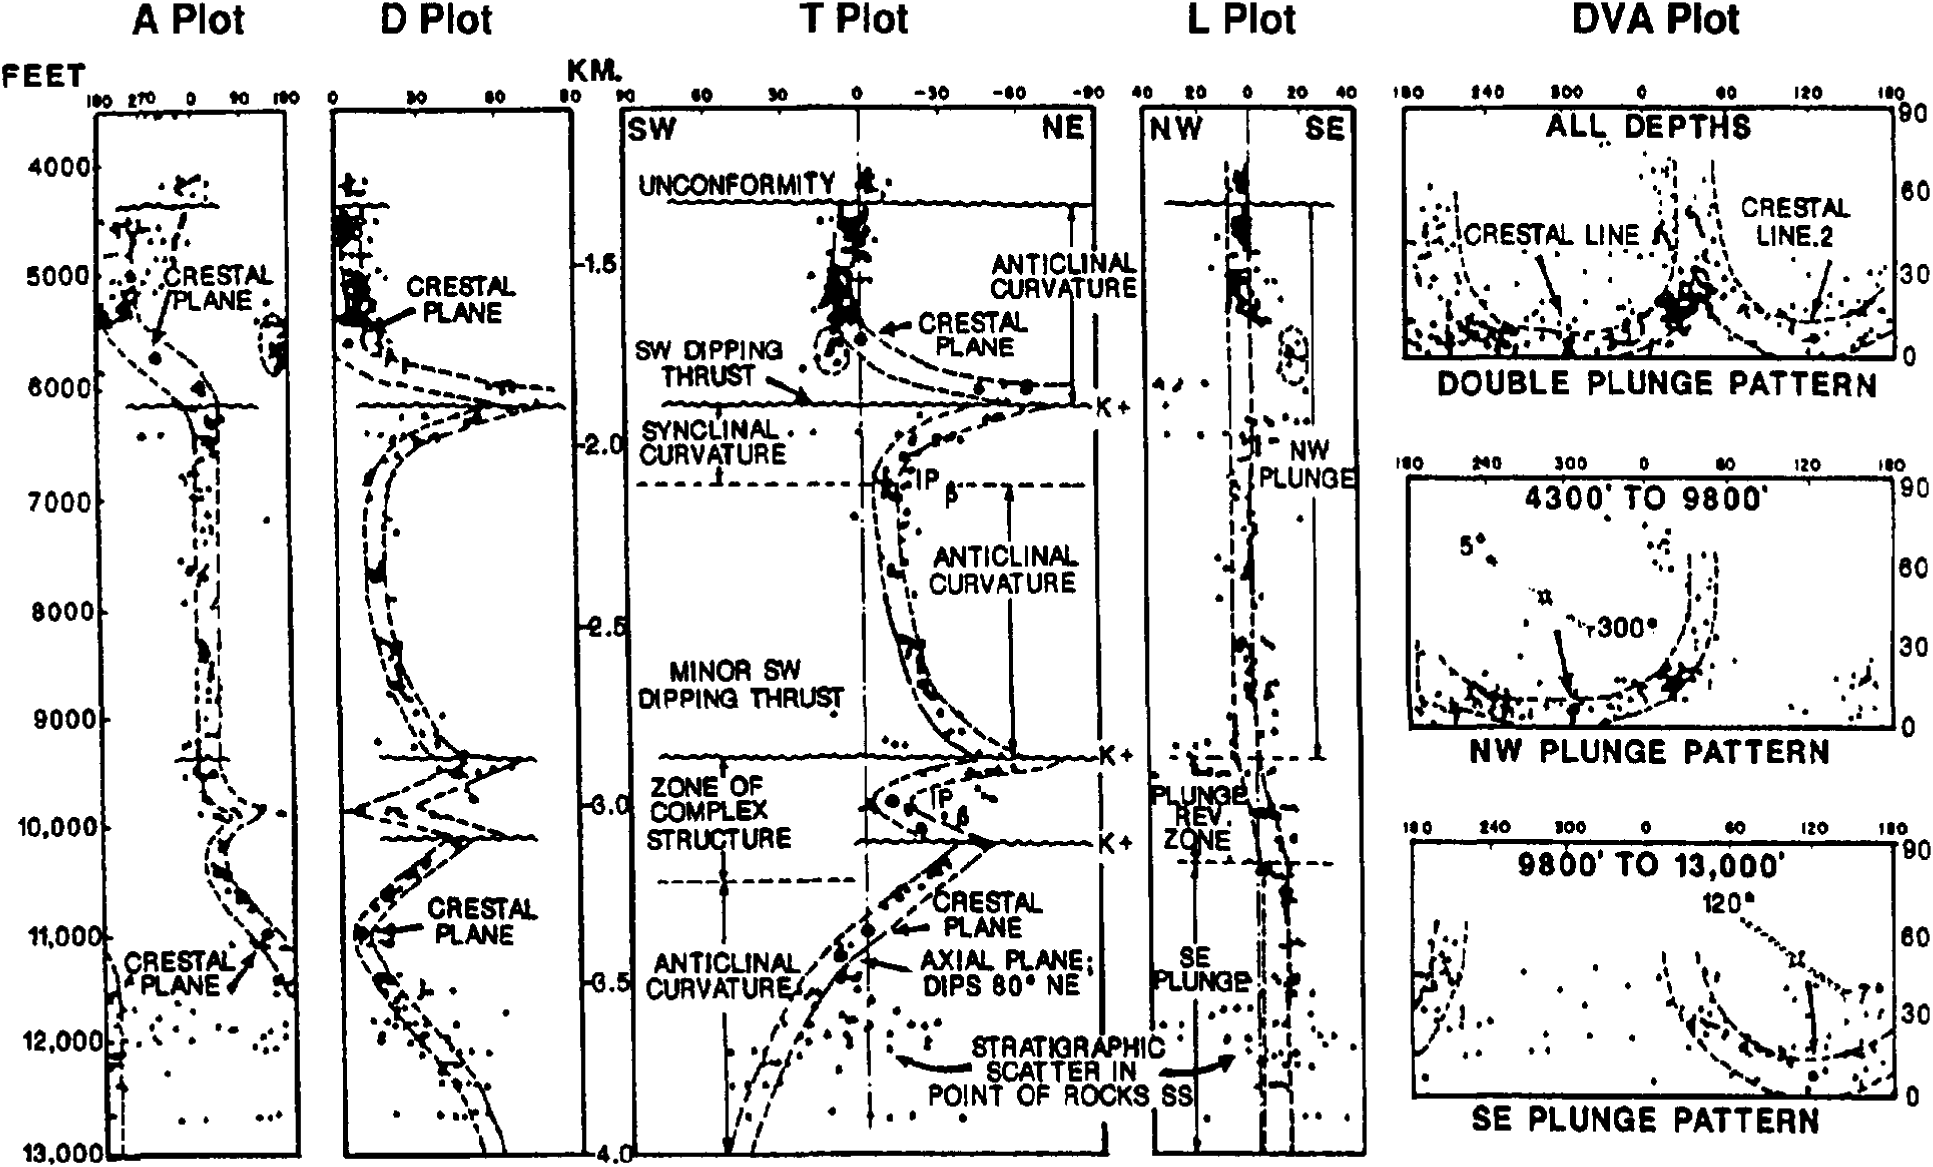
SCAT plots used to define the complex structure seen in the discovery well of the Rail Road Gap oil field, California. The five plot types are (from left to right) azimuth versus depth (A plot), dip versus depth (D plot), dip versus depth in the direction of greatest curvature (T plot), dip versus depth in the direction of least curvature (L plot), and dip versus azimuth (DVA plot). (From Bengtsen, 1982.)
File history
Click on a date/time to view the file as it appeared at that time.
| Date/Time | Thumbnail | Dimensions | User | Comment | |
|---|---|---|---|---|---|
| current | 18:47, 14 January 2014 | | 1,933 × 1,167 (174 KB) | Importer (talk | contribs) | SCAT plots used to define the complex structure seen in the discovery well of the Rail Road Gap oil field, California. The five plot types are (from left to right) azimuth versus depth (A plot), dip versus depth (D plot), dip versus depth in the direct... |
You cannot overwrite this file.
File usage
The following page uses this file: