File:Evaluating-structurally-complex-reservoirs fig2.png
Jump to navigation
Jump to search

Size of this preview: 800 × 514 pixels. Other resolutions: 320 × 206 pixels | 1,890 × 1,215 pixels.
Original file (1,890 × 1,215 pixels, file size: 150 KB, MIME type: image/png)
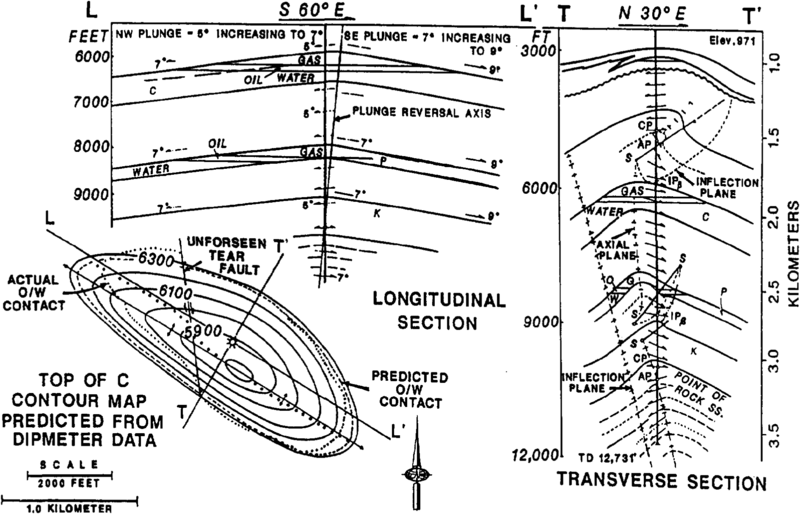
Predicted transverse and longitudinal cross sections and contour map derived from SCAT plots. Depths are subsea depths. (From Bengtsen, 1982.)
File history
Click on a date/time to view the file as it appeared at that time.
| Date/Time | Thumbnail | Dimensions | User | Comment | |
|---|---|---|---|---|---|
| current | 18:47, 14 January 2014 | | 1,890 × 1,215 (150 KB) | Importer (talk | contribs) | Predicted transverse and longitudinal cross sections and contour map derived from SCAT plots. Depths are subsea depths. (From Bengtsen, 1982.) Category:Geological methods |
You cannot overwrite this file.
File usage
The following page uses this file: