File:Figure-3.jpg
Jump to navigation
Jump to search

Size of this preview: 800 × 397 pixels. Other resolutions: 320 × 159 pixels | 1,502 × 746 pixels.
Original file (1,502 × 746 pixels, file size: 180 KB, MIME type: image/jpeg)
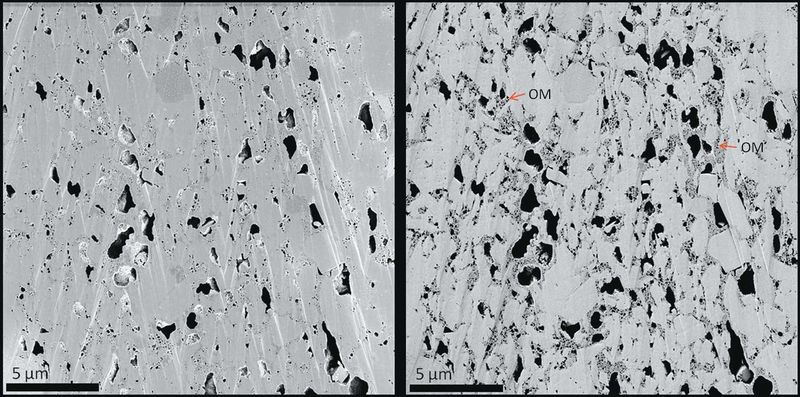
A shale sample imaged using SE1 signal (left) and SE2 signal (right). Surface-specific information such as pore space and surface roughness is evident in the SE1 image. The SE2 image has more compositional influence, displaying organic matter (OM) bodies that are not evident in the SE1 image. From AAPG Memoir 102, Chapter 1, Huang et al., 2013, DOI: 10.1306/13391699M1023580.
File history
Click on a date/time to view the file as it appeared at that time.
| Date/Time | Thumbnail | Dimensions | User | Comment | |
|---|---|---|---|---|---|
| current | 17:32, 15 August 2014 | | 1,502 × 746 (180 KB) | Molyneux (talk | contribs) | A shale sample imaged using SE1 signal (left) and SE2 signal (right). Surface-specific information such as pore space and surface roughness is evident in the SE1 image. The SE2 image has more compositional influence, displaying organic matter (OM) bodi... |
You cannot overwrite this file.
File usage
The following page uses this file: