File:Lithofacies-and-environmental-analysis-of-clastic-depositional-systems fig3.png
Jump to navigation
Jump to search
Size of this preview: 748 × 600 pixels. Other resolutions: 300 × 240 pixels | 1,950 × 1,563 pixels.
Original file (1,950 × 1,563 pixels, file size: 201 KB, MIME type: image/png)
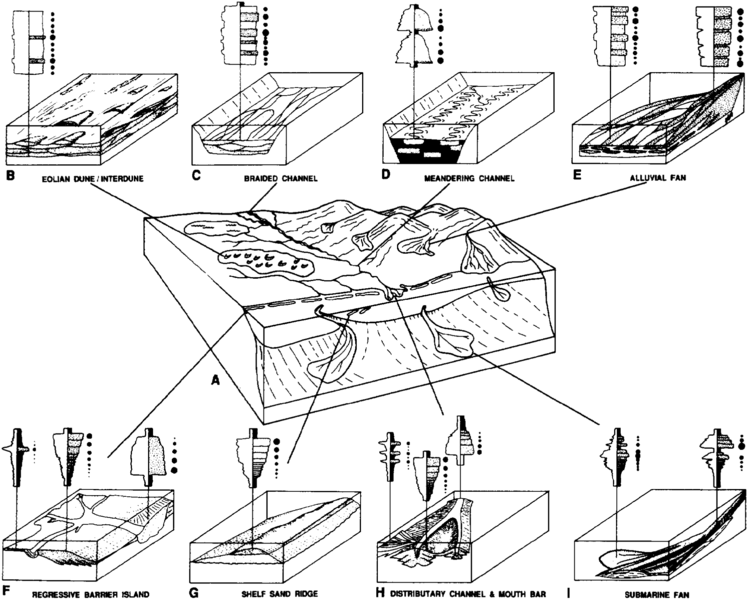
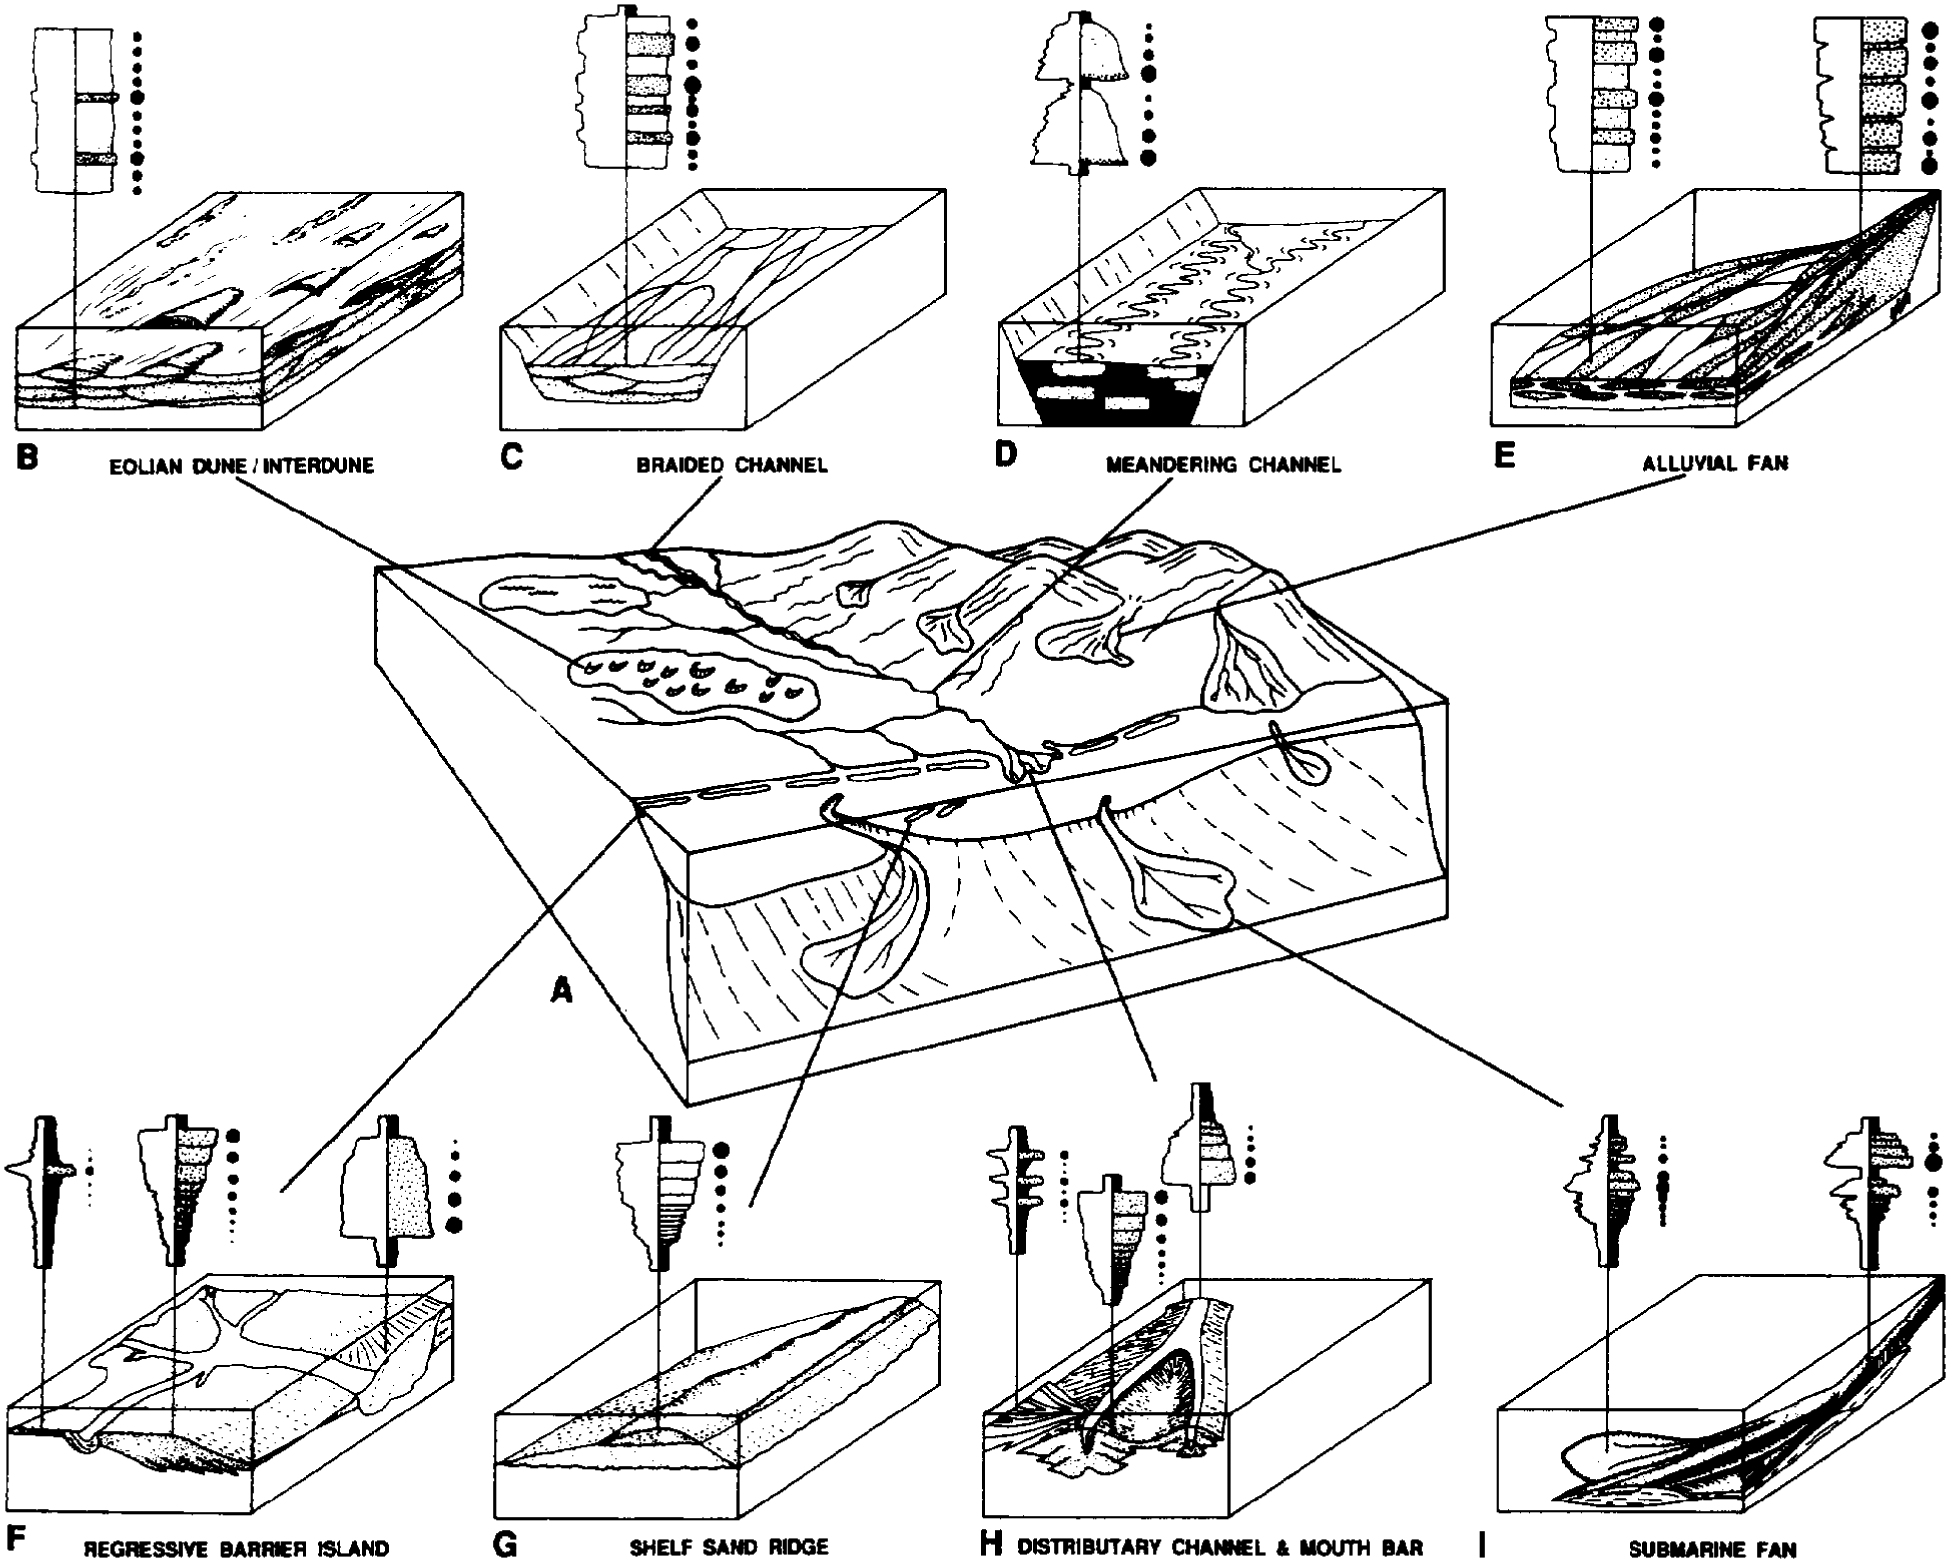
Models of major depositional environments. The curve on the left shows the SP or gamma ray response and the curve on the right shows the relative grain size profile. The size of the dots next to the vertical profile indicates the relative magnitude of permeability expected in such a sequence. (Parts c and d are from Walker, 1984, and parts f, h, and i are from Galloway and Hobday, 1983.)
File history
Click on a date/time to view the file as it appeared at that time.
| Date/Time | Thumbnail | Dimensions | User | Comment | |
|---|---|---|---|---|---|
| current | 21:37, 13 January 2014 | | 1,950 × 1,563 (201 KB) | Importer (talk | contribs) | Models of major depositional environments. The curve on the left shows the SP or gamma ray response and the curve on the right shows the relative grain size profile. The size of the dots next to the vertical profile indicates the relative magnitude of ... |
You cannot overwrite this file.
File usage
The following page uses this file: