Lithofacies maps
| Oil Field Production Geology | |

| |
| Series | Memoir |
|---|---|
| Chapter | Lithofacies maps |
| Author | Mike Shepherd |
| Link | Web page |
| PDF file (requires access) | |
| Store | AAPG Store |
Lithofacies maps show the areal variation in the depositional patterns that make up each genetic sequence within the reservoir interval. The method for constructing lithofacies maps involves extrapolating the lithofacies from the wells into the gaps between the wells. This is not easy, as there will be mostly vertical or near vertical well data in the field. The vertical facies profile may be determined reasonably confidently; however, the lateral facies progression will have to be inferred by analog and other means.
Use of analogs for lithofacies mapping
The practice of making lithofacies maps with the help of modern analogs is an effective method for filling in the gaps in the subsurface.[1] Modern analogs show the geometrical interrelationship of the various sedimentary bodies; they also permit the width and length of the various macroforms to be readily measured.
However, there are limitations to the use of modern analogs. Certain macroforms lack preservation potential and may not be common in the subsurface because of erosion. Conditions today may not be anything like the prevailing conditions when a given interval of reservoir sediments formed. The present day has a specific climate, tectonic variability, relative position of sea level, and rate of sea level change.[2] For example, the continents are mountainous and widely dispersed, with a tendency for shorelines to cut predominantly north–south across the world's climate zones. The Earth currently has ice caps but has lacked them for large parts of its geological history.
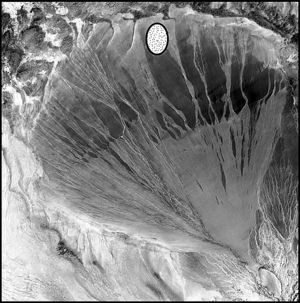
Modern and ancient analogs can be investigated by referring to technical papers and outcrop studies, or the examination of aerial photographs.[3] The latter is a particularly vivid source of information (Figure 1). Geologists working on carbonate reservoirs, for example, should have a look at the AAPG publication on modern day carbonate environments.[4] The book includes a series of aerial photographs along with a transparent overlay giving the outlines of typical carbonate fields. This gives a very good impression of the size of depositional environments relative to the field scale. The photographs illustrate the fact that many depositional environments cover a much larger area than oil fields. This is an important observation. Because depositional environments extend over a greater area than the field, the geologist should investigate the sedimentology at the larger (basin) scale to get a realistic idea of the basinal controls influencing the sediments at the field scale.
Satellite photographs are available for consultation on the Internet; for example, Google Earth™. The site provides an easily accessible integrated network of satellite photographs spanning the globe. These can be examined at any scale. The program also provides a measuring tool, which allows sediment body dimensions to be readily derived. Table 1 provides a list of some potential reservoir analogs to look at on satellite photographs.
| Depositional Environment | Location | Latitude | Longitude |
|---|---|---|---|
| Desert dune field | Namibia | 24°49'27.07"S | 15°22'50.95"E |
| Barchan dunes | China | 39°51'13.70"N | 102°35'24.13"E |
| Sabkha lake | Tunisia | 33°41'28.31"N | 8°28'21.40"E |
| Alluvial fans | United States | 36°10'42.30"N | 116°54'12.46"E |
| Braided river | Madagascar | 21°45'32.20"S | 43°53'57.55"E |
| Braided river | New Zealand | 43°42'57.69"S | 171°57'56.03"E |
| Meander belt | Russia | 58°49'39.10"N | 81°30'57.08"E |
| Meander belt | Brazil | 6°55'21.12"S | 64°39'25.27"W |
| Fluvial-dominated delta | United States | 29°08'59.92"N | 89°03'50.92"W |
| Wave-dominated delta | Egypt | 31°00'49.72"N | 31°11'27.04"E |
| Wave-dominated delta | Brazil | 21°37'51.28"S | 41°03'04.50"W |
| Tidal-dominated delta | Papua and New Guinea | 8°34'51.89"S | 143°25'20.90"E |
| Clastic tidal flat | Netherlands | 53°11'31.51N | 4°59'52.95"E |
| Barrier-bar coastline | United States | 36°02'30.32"N | 75°46'33.57"W |
| Beach strand plain | Mexico | 21°56'28.24"N | 105°34'13.71"W |
| Barrier reef and lagoon | Turks and Caicos | 22°45'57.95"N | 74°10'43.93"W |
| Ooid shoal | Bahamas | 25°16'01.93"N | 78°08'55.80"W |
| Carbonate tidal flat | Bahamas | 25°01'17.43"N | 78°10'53.89"W |
A useful source of data comes from modern-day sedimentary analogs where shallow borehole data, shallow seismic data, or ground penetrating radar surveys are available. An example of a modern day analog with boreholes is the study by Van Heerden and Roberts[6] of the Atchafalaya delta lobe of the Mississippi delta. Similarly, 3-D seismic data at shallow depths can give a detailed image of depositional systems at a resolution suitable for reservoir analogs.[7] [8] [9]
Outcrops allow the geometrical patterns shown by lateral facies variation to be inspected. They may be less reliable as a direct analog for reservoirs by comparison to modern-day environments because their origin requires interpretation, and this introduces an element of subjectivity. Nevertheless, they will provide sedimentological information directly comparable to cores from the subsurface. Perhaps the ideal analog database involves a combination of images from modern-day environments for geometrical data and outcrops for a sedimentological comparison.
Three-dimensional seismic geomorphology
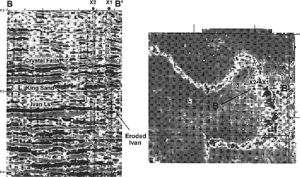
It may be possible under favorable circumstances to obtain sedimentological information from seismic data (Figure 2). For this to happen, sedimentary bodies should be of sufficient thickness relative to the seismic frequency. They will also need to show an acoustic impedance contrast large enough for them to be seen on seismic sections.[11] For a sand body to be picked out seismically, this means in practice that it should be thick enough to be seismically resolvable (tens of meters thick) and surrounded by shale.
Geophysicists can create amplitude maps of a horizon very quickly by autotracking a seismic pick on a workstation. Having picked a few representative lines to define the horizon, the computer software proceeds to pick the horizon everywhere else. Fluvial meander belts are commonly well differentiated on horizon slice amplitude displays.[12] [13] [14] [15] A study in the Powderhorn field of Texas showed that the most distinct amplitude display images from seismic data could be derived from sand-prone lithofacies associations surrounded by muddy lithofacies.[16] These included coastal stream plain, delta, and delta plain depositional environments along with pinch-outs of back-barrier sandstones into lagoonal shales.
Carbonate sediments produce distinctive seismic facies with reefs and marginal reef environments commonly well imaged.[17] [18][19] Deep-water marine deposits typically show sharp lithological contrasts between sand bodies and the encasing deep marine mudstones. These enable the sandstones to be picked on horizon slice amplitude and semblance displays.[20] [21] Semblance displays (also known as coherence cubetrade displays) are computed from seismic data by comparing the similarity of each seismic trace with its neighbors within a specific window of interest. Significant changes in the response corresponding to sand pinch-outs or faults are highlighted as edges.[22] [23]
Geometrical patterns that allow depositional sedimentary environments to be recognized can sometimes be picked out by seismic facies analysis.[8] Seismic facies analysis involves the analysis of seismic character to help predict the depositional environment. One method uses a computer-based neural network analysis of waveform character within a window of seismic data. A map is made showing the areal distribution of the waveform character classes, and this can be correlated with lithofacies variation.
Semblance and spectral decomposition methods were used to pick out individual macroforms in Pleistocene deltaic sediments in the Gulf of Mexico.[24] Spectral decomposition is a way of breaking down a seismic trace into its discrete component frequencies.[25] Certain stratigraphic features can be picked out because they are more sensitively tuned to specific frequencies although they may not be obvious in the seismic trace as a whole.
Determining the basin topography
Various maps can be constructed that allow the basin topography or bathymetry to be defined. The idea is to pick out sedimentary depocenters, dispersal patterns, and topographical features that may have influenced the distribution of sediments in the reservoir interval.
Sandstone percentage maps are contour maps that show the percentage thickness of sandstone within a gross rock interval. These can give a good indication of the sediment dispersal patterns and lateral pinch-out edges. Gross sandstone thickness maps, which are maps of the total thickness of sandstone within an interval, help determine the locations of sediment depocenters. These maps can also be used to infer depositional strike and depositional dip. Depositional strike is the dominant direction along which sedimentary bodies tend to be elongated. Depositional dip is the direction perpendicular to the depositional strike.
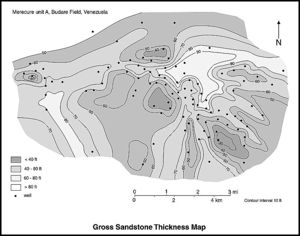
Hamilton et al.[10] described the reservoir characterization of the Tertiary deltaic sediments in the Merecure unit A reservoir interval of the Budare field in Venezuela. The gross sandstone thickness map shows a dominant east–west grain defined by elongate, thick sandstone bodies. Narrower north–south lineaments are perpendicular to this main trend. The depositional environment is interpreted as a wave-dominated delta system. North–south-oriented features interpreted as distributary channels intersect at an oblique angle with arcuate to linear oriented trends interpreted as a marine reworked delta front (Figure 3).
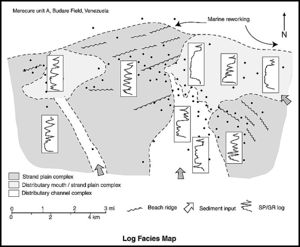
Log facies maps give a sense of the internal sedimentary character of a reservoir interval.[27] For each well, a paper copy of the gamma-ray log is trimmed to the top and base of the reservoir unit of interest and pasted on a map. Computer applications are also available to help make these displays. Log facies maps give a visual impression of how the log facies varies over the field in terms of distribution, trends, and internal bedding characteristics. The various log patterns can be mapped across the field and then tied in to a lithofacies scheme (Figure 4). In the Budare field example from Venezuela,[10] discrete zones of log character were mapped out. Blocky log profiles are related to distributary channel and aggradational mouth bar complexes, whereas multiple, thin serrated and subtly upward-coarsening log facies are interpreted as strand plain complexes flanking the delta front.
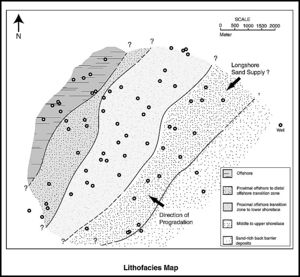
The end result is a series of lithofacies maps for each depositional sequence in the reservoir (Figure 5). These show the areal distribution of the various macroforms comprising a specific stratigraphic sequence.
See also
References
- ↑ Galloway, W. E., and D. K. Hobday, 1996, Terrigenous clastic depositional systems: Applications to petroleum, coal, and uranium exploration: New York, Springer-Verlag, 489 p.
- ↑ Grammer, G. M., P. M. Harris, and G. P. Eberli, 2004, Integration of outcrop and modern analogs in reservoir modeling: Overview with examples from the Bahamas, in G. M. Grammer, P. M. Harris, and G. P. Eberlie, eds., Integration of outcrop and modern analogs in reservoir modeling: AAPG Memoir 80, p. 1-22.
- ↑ Tye, R. S., 2004, Geomorphology: An approach to determining subsurface reservoir dimensions: AAPG Bulletin, v. 88, no. 8, p. 1123-1147.
- ↑ Harris, P. M., and W. S. Kowalik, eds., 1994, Satellite images of carbonate depositional environments: AAPG Methods in Exploration Series 11, 147 p.
- ↑ Burnett, M., 1996, 3-D seismic expression of a shallow fluvial system in west central Texas, in P. Weimer and T. L. Davis, eds., Applications of 3-D Seismic Data to Exploration and Production: AAPG Studies in Geology 42/SEG Geophysical Developments Series 5, p. 45-56.
- ↑ Van Heerden, I. L., and H. H. Roberts, 1988, Facies development of Atchafalaya delta, Louisiana: A modern bayhead delta: AAPG Bulletin, v. 72, no. 4, p. 439–453.
- ↑ Fowler, J. N., E. Guritno, P. Sherwood, M. J. Smith, S. Algar, I. Busono, G. Goffey, and A. Strong, 2004, Depositional architecture of Recent deep-water deposits in the Kutei Basin, East Kalimantan, in R. J. Davies, J. A. Cartwright, S. A. Stewart, S. A. Lappin, and J. R. Underhill, eds., 3-D seismic technology, applications to the exploration of sedimentary basins: Geological Society (London) Memoir 29, p. 25–33.
- ↑ 8.0 8.1 Posamentier, H. W., 2004, Seismic geomorphology: Imaging elements of depositional systems from shelf to deep basin using 3-D seismic data: Implications for exploration and development, in R. J. Davies, J. A. Cartwright, S. A. Stewart, S. A. Lappin, and J. R. Underhill, eds., 3-D seismic technology, applications to the exploration of sedimentary basins: Geological Society (London) Memoir 29, p. 11–24.
- ↑ Steffens, G. S., R. C. Shipp, B. E. Prather, A. Nott, J. L. Gibson, and C. D. Winker, 2004, The use of near-sea floor 3D seismic data in deep-water exploration and production, in R. J. Davies, J. A. Cartwright, S. A. Stewart, S. A. Lappin, and J. R. Underhill, eds., 3D seismic technology, applications to the exploration of sedimentary basins: Geological Society (London) Memoir 29, p. 35–43.
- ↑ 10.0 10.1 10.2 10.3 Hamilton, D. S., N. Tyler, R. Tyler, S. K. Raeuchle, M. H. Holtz, J. Yeh, M. Uxcategul, T. Jimenez, A. Salazar, C. E. Cova, R. Barbato, and A. Rusic, 2002, Reactivation of mature oil fields through advanced reservoir characterization: A case history of the Budare field, Venezuela: AAPG Bulletin, v. 86, no. 7, p. 1237–1262.
- ↑ Weber, K. J., 1993, The use of 3-D seismic in reservoir geological modelling, in S. S. Flint and I. D. Bryant, eds., The geological modelling of hydrocarbon reservoirs and outcrop analogs: International Association of Sedimentologists Special Publication 15, p. 181–188.
- ↑ Brown, A. R., C. G. Dahm, and R. J. Graebner, 1981, A stratigraphic case history using three-dimensional seismic data in the Gulf of Thailand: Geophysical Prospecting, v. 29, no. 3, p. 327–349.
- ↑ Rijks, E. J. K., and J. C. E. M. Jauffred, 1991, Attribute extraction: An important application in any detailed 3D interpretation study: Leading Edge, v. 10, no. 9, p. 11–19.
- ↑ Noah, J. T., G. S. Hofland, and K. Lemke, 1992, Seismic interpretation of meander channel point-bar deposits using realistic seismic modeling techniques: The Leading Edge, v. 11, p. 13–18.
- ↑ Carter, D. C., 2003, 3-D seismic geomorphology: Insights into fluvial reservoir deposition and performance, Widuri field, Java Sea: AAPG Bulletin, v. 87, no. 6, p. 909–934.
- ↑ eng, H., M. M. Backus, K. T. Barrow, and N. Tyler, 1996, Facies mapping from three-dimensional seismic data: Potential and guidelines from a Tertiary sandstone-shale sequence model, Powderhorn field, Calhoun County, Texas: AAPG Bulletin, v. 80, no. 1, p. 16–45.
- ↑ Fontaine, J. M., R. Cussey, J. Lacaze, R. Lanaud, and L. Yapaudjian, 1987, Seismic interpretation of carbonate depositional environments: AAPG Bulletin, v. 71, no. 3, p. 281–297.
- ↑ Masaferro, J. L., R. Bourne, and J.-C. Jauffred, 2003, 3D visualization of carbonate reservoirs: The Leading Edge, v. 19, no. 1, p. 18–25.
- ↑ Eberli, G. P., J. L. Masaferro, and J. F. Sarg, 2004, Introduction, in G. P. Eberli, J. L. Masaferro, and J. F. Sarg, eds., Seismic imaging of carbonate reservoirs and systems: AAPG Memoir 81, p. 1–9.
- ↑ Varnai, P., 1998, Three-dimensional seismic stratigraphic expression of Pliocene–Pleistocene turbidite systems, northern Green Canyon (offshore Louisiana), northern Gulf of Mexico: AAPG Bulletin, v. 82, no. 5B, p. 986–1012.
- ↑ Saller, A. H., J. T. Noah, A. P. Ruzuar, and R. Schneider, 2004, Linked lowstand delta to basin-floor fan deposition, offshore Indonesia: An analog for deep-water reservoir systems: AAPG Bulletin, v. 88, no. 1, p. 21–46.
- ↑ Bahorich, M., and S. Farmer, 1995, 3-D seismic discontinuity for faults and stratigraphic features: The coherency cube: The Leading Edge, v. 14, p. 1053–1058.
- ↑ Marfurt, K. J., R. L. Kirlin, S. L. Farmer, and M. S. Bahorich, 1998, 3-D seismic attributes using a semblance-based coherency algorithm: Geophysics, v. 63, no. 4, p. 1150–1165.
- ↑ Lopez, J. A., G. Partyka, N. L. Haskell, and S. E. Nissen, 1997, Identification of deltaic facies with 3-D seismic coherency and the spectral decomposition cube: A study from South Marsh Island Area, Gulf of Mexico: Gulf Coast Association of Geological Societies Transactions, v. 47, p. 305–309.
- ↑ Partyka, G., J. Gridley, and J. Lopez, 1999, Interpretational applications of spectral decomposition in reservoir characterization: The Leading Edge, v. 18, no. 3, p. 353–360.
- ↑ Guscott, S., K. Russell, A. Thickpenny, and R. Poddubiuk, 2003, The Scott field, Blocks 15/21a, 15/22, UK North Sea, in J. G. Gluyas and H. M. Hichens, eds., United Kingdom oil and gas fields, commemorative millennium volume: Geological Society (London) Memoir 20, p. 467–481.
- ↑ Shelton, J. W., 1972, Correlation sections and log maps in determination of sandstone trends: AAPG Bulletin, v. 56, no. 8, p. 1541–1544.