SEM, XRD, CL, and XF methods
| Development Geology Reference Manual | |

| |
| Series | Methods in Exploration |
|---|---|
| Part | Laboratory methods |
| Chapter | SEM, XRD, CL, and XF methods |
| Author | J. B. Thomas |
| Link | Web page |
| Store | AAPG Store |
The four methods commonly used for additional core analysis are
- Scanning electron microscopy (SEM)
- X-ray diffractometry (XRD)
- Cathodoluminescence (CL)
- X-ray fluoroscopy (XF)
These methods provide important extensions to thin section analysis and can be tied closely to log response and productivity. Table 1 summarizes the relative values of each and their limitations.
| Technique | General Operating Environment | Data Output | Advantages | Limitations |
|---|---|---|---|---|
| SEM | 20 kV approx. Vacuum chamber Low M.A. current | 3-D views of secondary Electron images. X-ray spectra for elements with Z> 10. | Pore geometry; grain morphology; diagenetic sequences; microtextures. Ties to some log response and φ-k analyses. |
|
| XRD | 10–40kV X-ray wavelength fixed. Low M.A. current | Diffraction patterns or digital files for comparison to “standards” files. | Mineralogy on semiquantitative scale. Best method for determining clay mineralogy. Does not require microscope. |
|
| CL | 12–20kV Vacuum chamber on microscope. Also visible on microprobe. Low M.A. current | Photographs: intensity relates to activator. Sensitizer and quencher ion content or lattice defect. | In carbonates, color zoning can be related to complex Eh-pH history. In clastics, lattice defect and activator ion content used in provenance and para-genesis studies. |
|
| XF | ±40 kV General current 3–200 M.A. | Photoradiographs video imaging. | Image often defines hidden character of sample, e.g., may show directional porosity and flow boundaries, internal structures of fossils. |
|
Scanning electron microscopy (SEM)
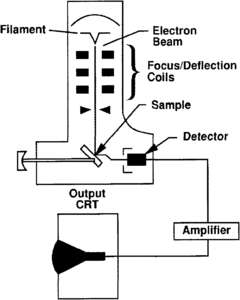
Figure 1 Schematic drawing of a common scanning electron microscope showing how the sample is “iluminated” by an electron beam and amplified for viewing by the operator.
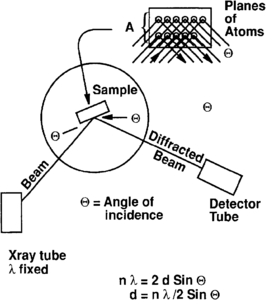
Figure 2 X-ray diffraction configuration. Knowledge of the wavelength (X) and angle of incidence allows the d spacing to be calculated.
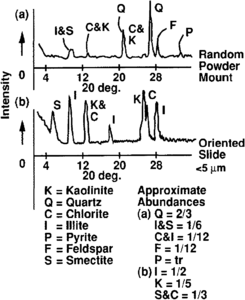
Figure 3 X-ray diffraction patterns.
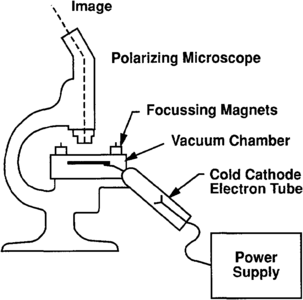
Figure 4 Schematic drawing showing how a typical cathodoluminescence system works. Depending on the manufacturer, the location of the cathode tube may differ.
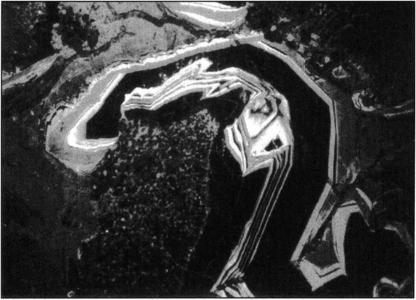
Figure 5 A photomicrograph taken under cathodoluminescence showing concentric zoning in dolomite cement. High Mn+2 dolomite shows up as bright bands and higher Fe+2 dolomite as dark bands. Copyright: W. J. Myers.
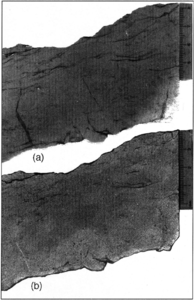
Figure 6 (a) X-ray fluoroscopy slab photograph and (b) plane light slab photograph of a Pennsylvanian sandstone from Oklahoma.


In SEM analysis, samples up to length::4 in. in diameter are struck by a focused beam of electrons in a vacuum chamber (Figure 1). The secondary and reflected primary electrons are detected and amplified. However, the sample must be conductive to the beam and generally is coated with a very thin layer of carbon or gold-palladium. A spectrum of X-rays are generated as the beam hits the sample. The X-radiation is resolved into characteristic peaks for various elements from fluorine (atomic number 2 = 9) and up. The images are recorded by photograph or video.
From the recorded three-dimensional images, the morphology of mineral and nonmineral grains and matrix samples can be documented. Pore roughness and interconnectedness can be evaluated. These data can then be related to reservoir flow parameters such as permeability and log response.[1] (For information on how grain and pore morphology affect permeability, see Permeability.)
X-ray diffraction (XRD)
The principal advantage of XRD is that a qualitative or semiquantitative evaluation of mineralogy is generated. A fixed wavelength X-ray source such as copper X-ray tubes, which have a 1.54A wavelength, is used to irradiate a powdered sample. The incident angle 9 (theta) of the diffracted beam and the intensity are recorded with a counter or tube (Figure 2). If parallel planes of atoms of a crystal are struck at the same angle, coherent (additive) intensity is detected and recorded as a peak. Bragg's Law (see [2]) is the basis for determining the characteristic peaks (d spacing) for known minerals and compounds (nλ = 2d sin θ). Tables of standards established by the JCPDS (Joint Council of Powder Diffraction Standards) can be consulted for mineral identification, where 6 is the incident angle, λ the X-ray wavelength and d the spacing between planes of atoms in the crystal.
Nonminerals such as solid hydrocarbons or glass cannot be identified by XRD because they lack sufficient internal structure.
Determination of bulk rock mineralogy is obtained from combined diffraction analysis of bulk powder and oriented mounts. Powder mounts are best for identification of nonplaty minerals. Platy minerals are best analyzed in slurries dried on metal, glass, or ceramic holders. This is especially true for clays with particle sizes ≤5 μm. Abundances are then determined by measuring peak intensity or half area for the diffraction peaks of the major three to five diffraction peaks of each mineral (Figure 3). A limitation of this method is the inability to determine abundances of mineral species (such as quartz from chert) or polymineral grains (such as granite from separate feldspar and quartz).
Cathodoluminescence (CL)
In CL, electrons from a cold cathode discharge tube strike a rock surface in a vacuum chamber (Figure 4). In a strong vacuum, energy imparted to electrons in activator ions within the grain causes luminescence. The principle activator ions are manganese and lead.[3] Concentrations need be in the 100 ppm range to affect the grain. Other rare earth elements such as dysprosium are also activators. Ferric iron (+3) is the most common quenching ion. The emitted color, when observed, shows the zonations in activator ion concentrations related to the type of crystallization or thermal histories of the host minerals (Figure 5). Lattice defect structures in quartz are also thought to cause some CL in quartz.
The most frequent application of CL is in carbonate diagenesis (e.g., Machel,[3] Myers[4]). As has been shown by Sippel,[5] it is also useful in determining paragenesis of siliciclastic rocks. It is particularly useful in interpreting original composition and texture in recrystallized or dolomitized strata.
X-ray fluoroscopy (XF)
X-ray fluoroscopy[6] requires a beam of X-rays at low current and widely ranging voltages passing through a sample, which is mounted in front of a phosphorus screen or film. The image produced is a “negative” governed by the X-ray absorption contrasts within the sample. Subtle differences in X-ray absorption accentuate masked structures in the sedimentary rock. In siliciclastic rocks, where mineralogy and thus X-ray absorption is more irregular, the results are better. In carbonate rocks, mineralogy variations are slight and images are often fuzzy. However, stylolite seams often show up well.
There has been much discussion on fluoroscopy applications using fluorescent dyes at low magnification related to coals and other minerals. Figure 6 shows the difference between irradiated and normal incident light for a sample. Note the short vertical fractures accentuated in the fluoroscopy photograph.
See also
- Core description
- Porosity
- Introduction to laboratory methods
- Relative permeability
- Paleontology
- Wettability
- Oil and condensate analysis
- Capillary pressure
- Oilfield water analysis
- Permeability
- Thin section analysis
- Rock-water reaction: formation damage
- Overview of routine core analysis
- Core-log transformations and porosity-permeability relationships
References
- ↑ Pittman, E. D., 1979, Porosity, diagenesis, and productive capability of sandstone reservoirs, in Scholle, P. A., Schluger, P. R., eds., Aspects of Diagenesis: Society Economic Paleontologists and Mineralogists Special Publication 26, p. 159–173.
- ↑ Cullity, B. D., 1959, Elements of X-ray Diffraction: Reading, MA, Addison-Wesley, 514 p.
- ↑ 3.0 3.1 Machel, H-G., 1985, Cathodoluminescence in calcite and dolomite and its chemical interpretation: Geoscience Canada, v. 12, p. 139–147.
- ↑ Myers, W. J., 1978, Carbonate cements—their regional distribution and interpretation in Mississippian limestones of southwestern New Mexico: Sedimentology, v. 25, p. 371–399.
- ↑ Sippel, R. T., 1968, Sandstone petrology, evidence from luminescence petrography: Journal of Sedimentary Petrology, v. 38, p. 530–554.
- ↑ Bouma, A. H., 1969, Methods for the Study of Sedimentary Structures: New York, John Wiley and Sons, 458 p.
External links
| find literature about SEM, XRD, CL, and XF methods |