Structural maps and cross sections
Jump to navigation
Jump to search
| Exploring for Oil and Gas Traps | |

| |
| Series | Treatise in Petroleum Geology |
|---|---|
| Part | Predicting the occurrence of oil and gas traps |
| Chapter | Exploring for structural traps |
| Author | R.A. Nelson, T.L. Patton, S. Serra |
| Link | Web page |
| Store | AAPG Store |
Basic tools of a structural play
Four basic tools must be put together in a structural play or prospect, regardless of local structural style, level of structural complexity, or exploration maturity:
- A structure contour map on top of the reservoir.
- An isopach map of the target reservoir—especially important if the reservoir displays significant stratigraphic thickness variation or has behaved in a ductile or compactive manner during deformation.
- Two or more structural cross sections incorporating all surface and subsurface control (wells and seismic data) projected into the line of section in both the strike and dip directions.
- Fault-surface maps (structural contours on the fault plane), made for all faults critical to closure at the top of the reservoir.
Guidelines for making maps and sections
Follow these guidelines when making maps and cross sections of a structural play.
- Construct maps using interpretive, not mechanical, mapping techniques.
- Make maps and sections at the same scale—in depth, not seismic time (if possible)—and internally consistent to one another.
- Use a 1:1 vertical to horizontal scale for sections. If this is impractical, construct sections with as little vertical exaggeration as possible to minimize distorting the true shape of the structures.
- For control, project wells into sections parallel to the structural contours.
- Check sections for geometric feasibility (i.e., balanced or restored) where appropriate.
- Integrate the contours of reservoir tops and fault surfaces to honor vertical separation along faults.
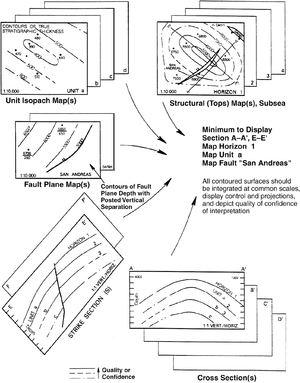
- Depict “known” vs. “inferred” or interpreted geometry on sections and maps. Display the relative subjective quality of interpreted geometry (low, medium, high). As shown in Figure 19-1, displaying the data in this manner allows the viewer to know where it is well and poorly constrained.
Integrating maps and sections
The schematic (Figure 1) represents how to integrate different maps and cross sections in a structural geology play. It also shows how to display levels of confidence of interpretation. (More control points are depicted than would normally be present in a prospect.)
