Thin section analysis
| Development Geology Reference Manual | |

| |
| Series | Methods in Exploration |
|---|---|
| Part | Laboratory methods |
| Chapter | Thin section analysis |
| Author | David W. Houseknecht |
| Link | Web page |
| Store | AAPG Store |

Petrographic analysis of thin sections made from rocks within the productive interval of an oil or gas field provides unique information regarding reservoir quality, reservoir homogeneity, and in some cases, the potential for formation damage that can be caused by completion and/or stimulation procedures.
Sample collection
Petrographic analysis can be performed on samples collected from conventional cores, rotary sidewall cores, percussion sidewall cores, or cuttings, but sample quality varies considerably.
Conventional cores are most desirable because samples can be collected from specific intervals of interest determined by a combination of direct observation of physical characteristics (such as facies), measured properties (such as porosity and permeability), and wireline log responses. They are also better because sample damage tends to be minimal. Thin sections are commonly made from porosity-permeability plugs cut from conventional cores because petrographic observations can be compared directly to porosity and permeability measurements.
Sidewall cores are less desirable because sampling sites are remotely selected based on log responses and because sample size is small. This introduces the possibility that the sidewall cores are not representative of the interval of interest. Rotary sidewall cores are preferred because they have better recovery in the most porous parts of a reservoir and because they usually display relatively little damage induced by coring. Percussion sidewall coring often recovers little sample, particularly in the most porous parts of a reservoir, and commonly induces fractures and disrupted fabrics within samples.
Cuttings are the least desirable because they are the least site specific of the sample types and because they disproportionately represent the least porous parts of a reservoir. The most porous parts commonly disintegrate into constituent grains. Moreover, it is difficult to evaluate the homogeneity of reservoir characteristics because of the small size of cuttings.
Sample preparation
Once samples have been selected, impregnation and thin sectioning procedures are critical to successful petrographic analysis. Samples are impregnated with low-viscosity epoxy introduced while the samples are under a vacuum. After vacuum impregnation, some laboratories apply pressure via an inert gas to force the epoxy into small pores. The epoxy is stained, usually blue, to facilitate observation of porosity once thin sections have been completed. Epoxy can also be “stained” with fluorescent dye, either during impregnation or after thin sections are completed, to enhance observation of relatively small pores when thin sections are viewed under incident fluorescent light.[2] Thin sections must be carefully ground to final thickness (usually 30 μm) to avoid fracturing and plucking.
At this stage, samples can be stained for specific minerals if warranted by rock composition and objectives of the petrographic analysis. Common stains are available for calcite, dolomite, ferrous carbonate, K-feldspar, and plagioclase. Thin sections are then either covered or left uncovered. The conventional practice of gluing cover slips onto thin sections with either Canada balsam or epoxy is decreasing in popularity because many analyses must be performed on uncovered thin sections. Thin sections that are not polished can be “covered” with colorless fingernail polish. If thin sections are to be analyzed by cathodoluminescence or microprobe techniques, they must be polished to yield suitable results.
Petrographic techniques
Basic petrographic analysis is performed in transmitted light using a polarizing microscope. Certain petrographic problems require the use of a cathodoluminescence (CL) microscope (see SEM, XRD, CL, and XF methods). CL petrography is used to detect cement stratigraphy and original fabrics in recrystallized carbonate rocks[3] and to distinguish between detrital quartz grains and authigenic quartz overgrowths (cement) in sandstones.[4]
Petrographic analysis of thin sections in either transmitted light or CL can involve either qualitative description or quantitative estimation of rock properties, depending upon objectives of the analysis. Quantitative estimation of composition and porosity types by modal analysis (point counting) is recommended for both carbonate and sandstone reservoir rocks. In addition, quantitative estimation of textural parameters (grain size and sorting) is recommended for sandstones.
Compositional analysis
Modal analysis involves identification of rock constituents at a number of locations, or “points,” in a thin section.[5] The number of points counted per thin section, and therefore the labor intensiveness of the analysis, depends upon the precision required. For most applications, at least 300 points must be counted per thin section to ensure an acceptable level of precision. Data derived from point counting can be used to evaluate quantitatively which rock properties significantly influence reservoir quality and to estimate the abundance of various porosity types that are present.
Computer-based image analysis of petrographic images is emerging as a rapid method of estimating certain compositional properties of sedimentary rocks (including porosity). This technology will surely become more widely used in coming years.
Textural analysis
Textures of sandstones can be qualitatively described by using standard images to estimate the size, sorting, sphericity, and roundness of clastic particles. Quantitative textural analysis involves measurement of a certain number of grains (commonly 100 per thin section) so that mean grain size and sorting (standard deviation) can be calculated. Grain size measurements can be performed on a transmitted light microscope equipped with a graduated ocular lens, or they can be done by placing thin sections in a microfiche reader and measuring grains with a ruler. Whichever instrument is used, a glass slide inscribed with a metric scale must be used to determine a conversion factor for converting raw data to millimeters.
Once data are converted to millimeters, it is also recommended that the data be converted to the phi scale, where the grain size in phi = –log2 × grain size in mm. Mean grain size and sorting (standard deviation of grain size measurements) are then calculated. Mean grain size can be expressed in either the millimeter or phi scale, but sorting must be expressed in the phi scale to maintain a sorting index that is useful across a wide range of grain sizes.
Sandstone reservoirs
Three fundamental properties should be documented petrographically to evaluate reservoir quality, to plan reservoir stimulation procedures, and to help assess the potential for formation damage (in concert with SEM, XRD, and other analyses). These are texture, composition, and porosity.
Texture
The grain size and sorting of clastic sediment exerts a profound influence on reservoir properties. Grain size has little influence on porosity, but increasing grain size results in significantly higher permeability.[6] Sorting also influences reservoir quality, with better sorted sands displaying higher porosity and permeability.[6] Even though diagenesis may alter these relationships in reservoir rocks, many sandstone reservoirs retain relative porosity and, especially, permeability patterns that can be explained by grain size and sorting variations controlled by depositional facies.
Composition
The mineralogy and volumes of framework grains, cement, and matrix are essential for reconstructing the diagenetic history of a sandstone and for assessing the potential for formation damage that may be caused by completion and/or stimulation procedures.
Framework grains
Framework grain compositions commonly influence the diagenetic history and reservoir quality of a sandstone by controlling compaction and chemical interaction with pore fluids. Sandstones that contain ductile lithic fragments such as shale or slate compact at shallower depths than sandstones composed mostly of brittle grains such as quartz and feldspar. Therefore, the preservation of primary intergranular porosity may be dependent upon original framework grain composition and the compactional history of the sandstone.
Chemical interaction between framework grains and pore fluids can either reduce or enhance porosity. Certain grains provide preferential nucleation sites for common cements. For example, the presence or absence of nucleation sites on detrital quartz grains influences the volume of quartz overgrowths precipitated and therefore the amount of porosity preserved in some sandstones. Chemical interaction of framework grains with some pore fluids can enhance porosity by grain dissolution. For example, a sandstone facies containing chemically unstable grains (commonly feldspar or various lithic fragments) might undergo porosity enhancement by dissolution of those grains. In the same formation, less porosity enhancement would occur in a quartz-rich facies containing fewer chemically unstable grains.
Cement
The composition and abundance of cements reflects the geochemical history of a reservoir sandstone and may influence evaluation of reservoir stimulation procedures and potential for formation damage. Numerous minerals that commonly occur as cements in sandstones are known to dissolve and thereby contribute to porosity enhancement. However, recognition of cement dissolution porosity is often difficult because cement dissolution pores mimic primary pores, especially if the dissolved cement was restricted to intergranular space.
Matrix
Clay minerals commonly occur as both matrix and cement in reservoir sandstones.[7] Detrital matrix can be introduced into sand during or immediately following sedimentation by depositional processes, infiltration, and bioturbation. It can occur as grain coatings, dispersed matrix, laminae, or discrete grains. [ http://dictionary.reference.com/browse/authigenic Authigenic] clay cements commonly precipitate as grain coatings, pore fillings, and grain replacements. Virtually any clay mineral can occur in any of these modes, with kaolinite, chlorite, smectite, mixed layer illite-smectite, and illite occurring as common constituents of reservoir sandstones.
The presence of clay minerals of any origin has both direct and indirect effects on reservoir quality. Directly, clay minerals commonly result in lowered permeability because they constrict pore throats and promote higher irreducible water saturation. Indirectly, clay minerals commonly influence diagenetic processes that impact reservoir quality. For example, clay grain coatings in some sandstones have inhibited the nucleation of quartz overgrowths and thereby contributed to porosity preservation. However, clay grain coatings in other sandstones have promoted intergranular pressure solution and have thereby contributed to porosity destruction.
Clay minerals commonly pose potential formation damage problems. Fines migration can occur regardless of clay mineral composition. Clay swelling in response to certain completion or stimulation fluids locally occurs if smectites or mixed layer clays are present. The presence of iron-bearing clays may cause precipitation of iron hydroxide, which commonly damages permeability, as a by-product of acid stimulation if proper chelating agents are not used.
Porosity

During point counting, porosity is typically categorized into one of four categories: (1) primary intergranular porosity, (2) microporosity associated with clay minerals or other very fine mineral constituents, (3) dissolution porosity, and (4) fracture porosity.[8] Proportions of the first three porosity types can be conveniently displayed on a ternary diagram (Figure 1), which summarizes relative reservoir quality and some of the positive and negative attributes commonly associated with the three porosity types. (For more details on porosity types, see Porosity and Reservoir quality.)
Carbonate reservoirs
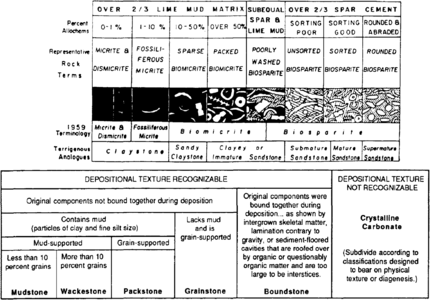
Figure 2 Carbonate classification schemes of (a) Folk[9] and (b) Dunham,[10] both based on textures observed in hand specimen or thin section. In Folk's scheme, the black pattern represents lime mud matrix, the lined pattern represents sparry calcite cement, and the white objects represent various carbonate grains.
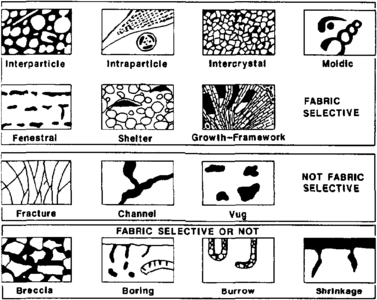
Figure 3 Idealized carbonate porosity system showing three basic porosity groups: fabric selective, not fabric selective, and fabric selective or not. (After Choquette and Pray.[11]


Petrographic analysis of carbonate reservoirs provides description of depositional facies, reconstruction of diagenetic history, and documentation of the porosity system.
Depositional facies of reservoir rocks can be inferred on a microscale if diagenesis has not obliterated original carbonate textures. Petrographers recognize a spectrum of original textures that range from mostly carbonate mud (low energy environments) through mostly sand-sized or larger carbonate grains (high energy environments). In fact, this spectrum of textures is the basis for the two most commonly used carbonate classifications, those of Folk[9] and Dunham,[10] summarized in Figure 2. In certain instances, variation in reservoir quality (porosity and permeability) can be explained on the basis of textural variation related to distribution of depositional facies within the carbonate reservoir.
Diagenetic history of carbonate reservoir rocks is important to reconstruct because it influences the volume, size, shape, and distribution of pores. Diagenesis may involve porosity-reducing cementation, porosity-enhancing dissolution, and recrystallization, which may result in either reduction or enhancement of porosity. An important goal of carbonate petrography is to establish the sequence of such events, or paragenesis, of the reservoir. Careful reconstruction of reservoir paragenesis can provide a perspective of the porosity system at the time of hydrocarbon accumulation, thereby enhancing the geologist's understanding of how reserves may be distributed relative to diagenetic facies.
Documentation of the porosity system within a carbonate reservoir provides a clear understanding of the origin and three dimensional distribution of pores. This information is typically collected by classifying individual pores into discrete categories[11] and by evaluating the degree to which the various pore types are interconnected. (For more on carbonate porosity types, see Table 1 and Figure 3.)
| Pore Type | Description |
|---|---|
| Fabric selective | |
| Interparticle | Porosity between particles |
| Intraparticle | Porosity within individual particles or grains |
| Intercrystal | Porosity between crystals |
| Moldic | Porosity formed by selective removal of an individual constituent of the rock |
| Fenestral | Pores larger than grain-supported interstices (interparticle) |
| Shelter | Porosity created by the sheltering effect of large sedimentary particles |
| Growth framework | Porosity created by in-place growth of a carbonate rock framework |
| Not fabric selective | |
| Fracture | Porosity formed by fracturing |
| Channel | Markedly elongate pores |
| Vug | Pores larger than 1/16 mm in diameter and somewhat equant in shape |
| Cavern | Very large channel or vug |
| Fabric selective or not | |
| Breccia | Interparticle porosity in breccia |
| Boring | Porosity created by boring organism |
| Burrow | Porosity created by organism burrowing |
| Shrinkage | Porosity produced by sediment shrinkage |
This analysis results in a conceptualization of the three-dimensional pathways that hydrocarbons must follow from their original location in the virgin reservoir to the wellbore. Knowing, for example, that porosity in a particular reservoir is selective to a specific depositional facies would allow a geologist to plan enhanced recovery by siting injection and withdrawal locations on the basis of facies distribution. In contrast, knowing that porosity is mostly not fabric selective (e.g., a combination of fracture and vuggy) would likely result in a very different plan for siting injection and withdrawal locations. Documentation of the porosity system also provides information that is fundamental to planning optimum reservoir stimulation procedures.
See also
References
- ↑ Jiang, Lei, Richard H. Worden, and Chun Fang Cai, 2014, Thermochemical sulfate reduction and fluid evolution of the Lower Triassic Feixianguan Formation sour gas reservoirs, northeast Sichuan Basin: AAPG Bulletin v. 98, no. 5, 947-973, DOI: 10.1306/10171312220.
- ↑ Ruzyla, K., Jezek, D. I., 1987, Staining method for recognition of pore space in thin and polished sections: Journal of Sedimentary Petrology, v. 57, p. 777–778, DOI: 10.1306/212F8C38-2B24-11D7-8648000102C1865D.
- ↑ Dorobek, S. L., 1987, Petrography, geochemistry, and origin of burial diagenetic facies, Siluro-Devonian Helderberg Group (carbonate rocks), central Appalachians: AAPG Bulletin, v. 71, p. 492–514.
- ↑ Houseknecht, D. W., 1987, Assessing the relative importance of compaction processes and cementation to reduction of porosity in sandstones: AAPG Bulletin, v. 71, p. 633–642.
- ↑ Galehouse, J. S., 1971, Point counting, in Carver, R. E., ed., Procedures in Sedimentary Petrology: New York, John Wiley and Sons, p. 385–407.
- ↑ 6.0 6.1 Beard, D. C., Weyl, P. K., 1973, Influence of texture on porosity and permeability of unconsolidated sand: AAPG Bulletin, v. 57, p. 349–369.
- ↑ Hagoort, J., 1984, Measurement of relative permeability for computer modeling/reservoir simulation: Oil and Gas Journal, Feb. 20, p. 62–68.
- ↑ 8.0 8.1 Pittman, E. D., 1979, Porosity, diagenesis, and productive capability of sandstone reservoirs, in Scholle, P. A., Schluger, P. R., eds., Aspects of Diagenesis: Society Economic Paleontologists and Mineralogists Special Publication 26, p. 159–173.
- ↑ 9.0 9.1 Folk, R. L., 1959, Practical petrographic classification of limestones: AAPG Bulletin, v. 43, p. 1–38.
- ↑ 10.0 10.1 Dunham, R. J., 1962, Classification of carbonate rocks according to depositional texture, in Ham, W. E., ed., Classification of Carbonate Rocks: AAPG Memoir 1, p. 108–121.
- ↑ 11.0 11.1 Choquette, P. W., Pray, L. C., 1970, Geological nomenclature and classification of porosity in sedimentary carbonates: AAPG Bulletin, v. 54, p. 207–250.
External links
| find literature about Thin section analysis |