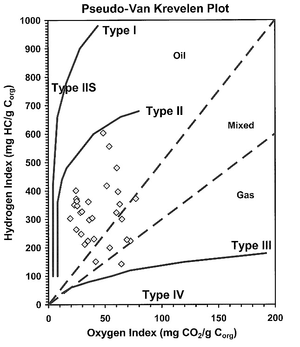
Van Krevelen diagram
Jump to navigation
Jump to search


Van Krevelen diagram.[1]
A plot of atomic oxygen/carbon (O/C) versus atomic hydrogen/carbon (H/C) originally used to classify coals and predict compositional evolution during thermal maturation, but adapted to classify kerogen types I, II, III, and IV. More common is the pseudo-Van Krevelen diagram, where Rock-Eval pyrolysis oxygen index ([OI] mg HC/g TOC) is plotted versus hydrogen index ([HI] mg HC/g TOC).[2]
This article is a stub. You can help AAPG Wiki by expanding it.
References
- ↑ Dembicki, H., 2009, Three common source rock evaluation errors made by geologists during prospect or play appraisals: AAPG Bulletin, vol. 93, issue 3, pp. 341-356.
- ↑ Peters, Kenneth E., David J. Curry, and Marek Kacewicz, 2012, An overview of basin and petroleum system modeling: Definitions and concepts, in Peters, Kenneth E., David J. Curry, and Marek Kacewicz, eds., Basin modeling: New horizons in research and applications: AAPG Hedberg Series no. 4, p. 1-16.