Difference between revisions of "Arecuna field"
Cwhitehurst (talk | contribs) |
Cwhitehurst (talk | contribs) |
||
| Line 15: | Line 15: | ||
}} | }} | ||
| − | Arecuna field is in the prolific Faja heavy-oil-producing region of eastern Venezuela (Audemard et al., 1985; Burkill and Rondon, 1991), which is in its earliest stages of primary recovery. Defined simply by the limits of the 100-km2 Arecuna 3-D seismic survey (Figure 1), Arecuna field contains an estimated 2.8 billion barrels of original oil in place, but to year-end 1996, it had produced only 2.2 million barrels of 7.5-16176.jpg (425 bytes) API oil from 35 producing wells. Initial completions were all from vertical wells, and typical flow rates, which were on the order of 200 barrels of oil per day (BOPD), were subeconomic. Moreover, some of the wells were already producing at 20-40% water cut. | + | Arecuna field is in the prolific Faja heavy-oil-producing region of eastern Venezuela (Audemard et al., 1985; Burkill and Rondon, 1991), which is in its earliest stages of primary recovery. Defined simply by the limits of the 100-km2 Arecuna 3-D seismic survey ([[:File:Methods14ch08f01.jpg|Figure 1]]), Arecuna field contains an estimated 2.8 billion barrels of original oil in place, but to year-end 1996, it had produced only 2.2 million barrels of 7.5-16176.jpg (425 bytes) API oil from 35 producing wells. Initial completions were all from vertical wells, and typical flow rates, which were on the order of 200 barrels of oil per day (BOPD), were subeconomic. Moreover, some of the wells were already producing at 20-40% water cut. |
==Geologic architecture of the Arecuna field== | ==Geologic architecture of the Arecuna field== | ||
| − | + | <gallery mode=packed heights=300px widths=300px> | |
| − | + | Methods14ch08f01.jpg|{{figure number|1}}Location of the Arecuna field study area in the heavy-oil belt (modified from Erlich and Barrett, 1992). | |
| + | Methods14ch08f02.jpg|{{figure number|2}}Reference log of the main producing interval at Arecuna field. Depth is in feet. | ||
| + | Methods14ch08f03.jpg|{{figure number|3}}Simplified stratigraphic cross section illustrating the flooding surface and lignite occurrence that defines the key stratigraphic subdivisions of Arecuna field. | ||
| + | Methods14ch08f04.jpg|{{figure number|4}}Seismic cross section illustrating the key seismic horizons of Arecuna field. | ||
| + | </gallery> | ||
===Stratigraphic Framework=== | ===Stratigraphic Framework=== | ||
| − | The main oil-bearing zones in the Arecuna field occur in the upper part of the Merecure Formation and throughout the Oficina Formation. The productive reservoir section is as much as 450 m (1500 ft) thick, and the stratigraphic analysis indicates that these productive intervals can be subdivided into 11 major stratigraphic units, three in the Merecure Formation and eight in the Oficina Formation (Figure 2). The units were identified by systematic vertical changes in bedding architecture (readily apparent on well-log traces) occurring above successive, laterally persistent high gamma-ray (or minimum spontaneous potential [SP]) shale markers that are interpreted as surfaces of maximum marine or lacustrine flooding. Widespread lignite beds also were used to divide the stratigraphic section (Figure 3). Because peat accumulation and preservation as lignite can occur only in the absence of significant clastic deposition (Hamilton and Tadros, 1994), lignite beds represent substantial periods of shutoff in sediment supply and approximate time lines separating successive depositional systems. | + | The main oil-bearing zones in the Arecuna field occur in the upper part of the Merecure Formation and throughout the Oficina Formation. The productive reservoir section is as much as 450 m (1500 ft) thick, and the stratigraphic analysis indicates that these productive intervals can be subdivided into 11 major stratigraphic units, three in the Merecure Formation and eight in the Oficina Formation ([[:File:Methods14ch08f02.jpg|Figure 2]]). The units were identified by systematic vertical changes in bedding architecture (readily apparent on well-log traces) occurring above successive, laterally persistent high gamma-ray (or minimum spontaneous potential [SP]) shale markers that are interpreted as surfaces of maximum marine or lacustrine flooding. Widespread lignite beds also were used to divide the stratigraphic section ([[:File:Methods14ch08f03.jpg|Figure 3]]). Because peat accumulation and preservation as lignite can occur only in the absence of significant clastic deposition (Hamilton and Tadros, 1994), lignite beds represent substantial periods of shutoff in sediment supply and approximate time lines separating successive depositional systems. |
| − | Architecture of the stratigraphic framework defined from well control mirrors that of the 3-D seismic data (Figure 3). Key stratigraphic surfaces readily identified on the well-log correlations (FS 40, 43, 45, 50, 60, 70, 90, and 100) were also readily identified on the seismic data (Figure 4). Both on the well logs and on the seismic data set, these sequences were characterized by uniform thicknesses and conformable seismic surfaces (except where postdepositional faulting removed section). Stratigraphic subdivision from well control was difficult between FS 60 and 70, which is consistent with the downlapping and truncated seismic geometries evident on the 3-D data log in this stratigraphic interval. | + | Architecture of the stratigraphic framework defined from well control mirrors that of the 3-D seismic data ([[:File:Methods14ch08f03.jpg|Figure 3]]). Key stratigraphic surfaces readily identified on the well-log correlations (FS 40, 43, 45, 50, 60, 70, 90, and 100) were also readily identified on the seismic data ([[:File:Methods14ch08f04.jpg|Figure 4]]). Both on the well logs and on the seismic data set, these sequences were characterized by uniform thicknesses and conformable seismic surfaces (except where postdepositional faulting removed section). Stratigraphic subdivision from well control was difficult between FS 60 and 70, which is consistent with the downlapping and truncated seismic geometries evident on the 3-D data log in this stratigraphic interval. |
The stratigraphic nomenclature was defined arbitrarily in this study to avoid confusion with existing Corpoven sandstone nomenclature. In general, however, the existing nomenclature and the flooding-surface-defined stratigraphy correspond, as shown in Table 1. | The stratigraphic nomenclature was defined arbitrarily in this study to avoid confusion with existing Corpoven sandstone nomenclature. In general, however, the existing nomenclature and the flooding-surface-defined stratigraphy correspond, as shown in Table 1. | ||
| Line 36: | Line 40: | ||
The sandstone-dominant lithology, broad sandstone distribution (Figure 5), and widespread blocky bedding architecture (Figure 6) provide evidence of river flow that was weakly confined across a broad alluvial plain, although there are well-developed interaxial belts that are sandstone poor. Unconfined bed-load fluvial systems of the Canterbury Plain, New Zealand (Figure 7; Leckie, 1994), perhaps provide the closest modern analog to Merecure Unit A, although these modern systems principally carry boulders, gravel, and very coarse sandstone. | The sandstone-dominant lithology, broad sandstone distribution (Figure 5), and widespread blocky bedding architecture (Figure 6) provide evidence of river flow that was weakly confined across a broad alluvial plain, although there are well-developed interaxial belts that are sandstone poor. Unconfined bed-load fluvial systems of the Canterbury Plain, New Zealand (Figure 7; Leckie, 1994), perhaps provide the closest modern analog to Merecure Unit A, although these modern systems principally carry boulders, gravel, and very coarse sandstone. | ||
| − | |||
| − | |||
[[File:Methods14ch08f05.jpg|thumb|300px|{{figure number|5}}Gross sandstone, Merecure Unit A (FS 90-100).]] | [[File:Methods14ch08f05.jpg|thumb|300px|{{figure number|5}}Gross sandstone, Merecure Unit A (FS 90-100).]] | ||
Revision as of 14:05, 17 December 2015
| Horizontal Wells: Focus on the Reservoir | |
| |
| Series | Methods in Exploration No. 14 |
|---|---|
| Chapter | Horizontal-well drilling in the heavy-oil belt, eastern Venezuela Basin: A postmortem of drilling experiences |
| Author | D. S. Hamilton, J. Yeh, P. Calderon, R. Barba, M. Rodriquez, J. Castillo, M. H. Holtz, M. Sanchez |
| Link | Web page |
| Store | AAPG Store |
Arecuna field is in the prolific Faja heavy-oil-producing region of eastern Venezuela (Audemard et al., 1985; Burkill and Rondon, 1991), which is in its earliest stages of primary recovery. Defined simply by the limits of the 100-km2 Arecuna 3-D seismic survey (Figure 1), Arecuna field contains an estimated 2.8 billion barrels of original oil in place, but to year-end 1996, it had produced only 2.2 million barrels of 7.5-16176.jpg (425 bytes) API oil from 35 producing wells. Initial completions were all from vertical wells, and typical flow rates, which were on the order of 200 barrels of oil per day (BOPD), were subeconomic. Moreover, some of the wells were already producing at 20-40% water cut.
Geologic architecture of the Arecuna field[edit]
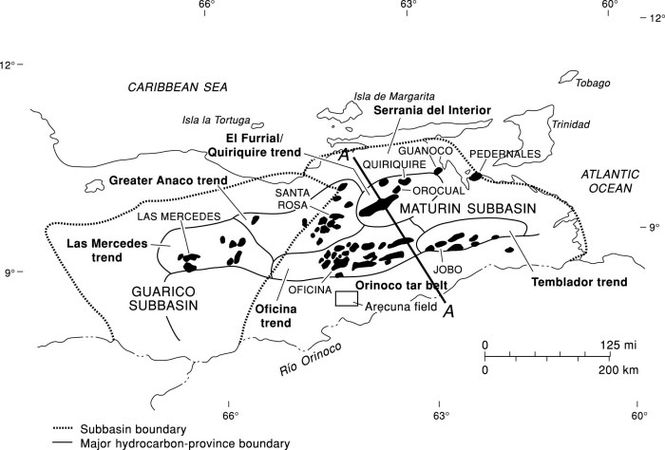
Figure 1 Location of the Arecuna field study area in the heavy-oil belt (modified from Erlich and Barrett, 1992).
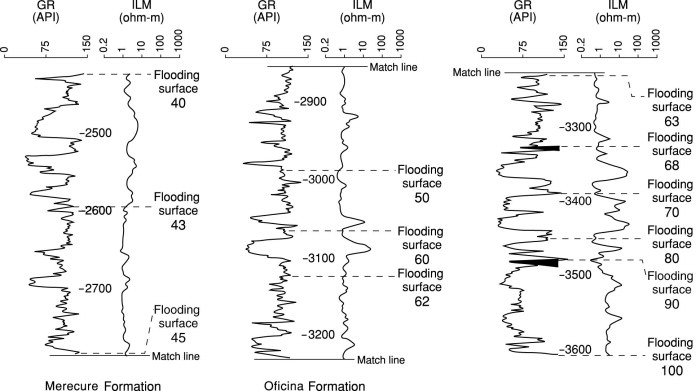
Figure 2 Reference log of the main producing interval at Arecuna field. Depth is in feet.
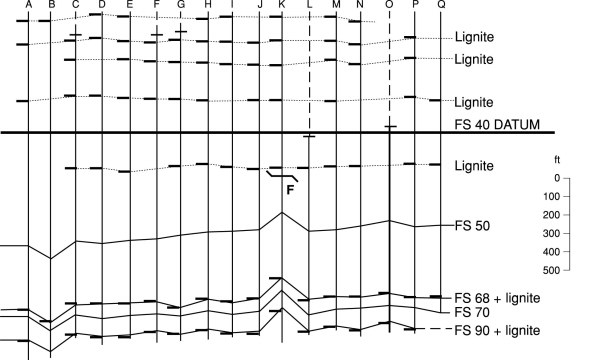
Figure 3 Simplified stratigraphic cross section illustrating the flooding surface and lignite occurrence that defines the key stratigraphic subdivisions of Arecuna field.
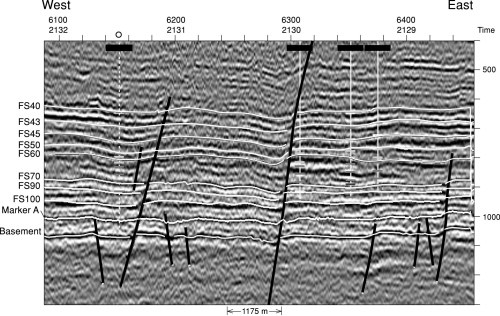
Figure 4 Seismic cross section illustrating the key seismic horizons of Arecuna field.


Stratigraphic Framework[edit]
The main oil-bearing zones in the Arecuna field occur in the upper part of the Merecure Formation and throughout the Oficina Formation. The productive reservoir section is as much as 450 m (1500 ft) thick, and the stratigraphic analysis indicates that these productive intervals can be subdivided into 11 major stratigraphic units, three in the Merecure Formation and eight in the Oficina Formation (Figure 2). The units were identified by systematic vertical changes in bedding architecture (readily apparent on well-log traces) occurring above successive, laterally persistent high gamma-ray (or minimum spontaneous potential [SP]) shale markers that are interpreted as surfaces of maximum marine or lacustrine flooding. Widespread lignite beds also were used to divide the stratigraphic section (Figure 3). Because peat accumulation and preservation as lignite can occur only in the absence of significant clastic deposition (Hamilton and Tadros, 1994), lignite beds represent substantial periods of shutoff in sediment supply and approximate time lines separating successive depositional systems.
Architecture of the stratigraphic framework defined from well control mirrors that of the 3-D seismic data (Figure 3). Key stratigraphic surfaces readily identified on the well-log correlations (FS 40, 43, 45, 50, 60, 70, 90, and 100) were also readily identified on the seismic data (Figure 4). Both on the well logs and on the seismic data set, these sequences were characterized by uniform thicknesses and conformable seismic surfaces (except where postdepositional faulting removed section). Stratigraphic subdivision from well control was difficult between FS 60 and 70, which is consistent with the downlapping and truncated seismic geometries evident on the 3-D data log in this stratigraphic interval.
The stratigraphic nomenclature was defined arbitrarily in this study to avoid confusion with existing Corpoven sandstone nomenclature. In general, however, the existing nomenclature and the flooding-surface-defined stratigraphy correspond, as shown in Table 1.
Depositional Systems[edit]
Once the stratigraphic framework was established, gross sandstone and log-facies maps (Galloway and Hobday, 1983) were constructed for the major stratigraphic units, to interpret the depositional setting of the Arecuna reservoirs and to allow prediction of reservoir thickness and continuity along the proposed horizontal-well trajectories in the interwell areas. The Arecuna reservoirs are interpreted as deposits of bed-load and mixed-load fluvial systems. Depositional systems of genetic stratigraphic units Merecure A and Oficina A and B illustrate the range of reservoir styles at Arecuna field.
Merecure Unit A[edit]
Merecure Unit A, defined between flooding surfaces 90 and 100 and locally referred to as the U2 and U3 sandstone (Figure 2), is interpreted as the deposit of a large-scale, braid-plain system. The unit varies from 33 to 51 m (110 to 170 ft) thick, and gross sandstone varies from 6 to 36 m (20 to 120 ft) thick. Although gross-sandstone trends are generally very broad, several digitate, north-oriented sandstone-rich axes are apparent (Figure 5). Small pods where gross sandstone is thin occur only locally in the broad, sandstone-rich trends. These sandstone trends suggest weakly confined river flow across a broad alluvial plain. The digitate sandstone-rich trends define axial channel belts, and the local pods, where net sandstone thins, represent areas of lacustrine ponds that developed intermittently during coarse, clastic-sediment bypass. Facies analysis, based on gamma-ray and SP log patterns, indicates that the unit is dominated by aggradational, blocky log patterns, and these are attributed to amalgamated sandstone channel fills that accumulated in the axial channel complexes (Figure 6). Interbedded mudstones displaying thin, spiky, and serrate gamma-ray and SP log motifs accumulated in the interaxial areas where intermittent coarse-clastic bypass led to local lacustrine inundation.
The sandstone-dominant lithology, broad sandstone distribution (Figure 5), and widespread blocky bedding architecture (Figure 6) provide evidence of river flow that was weakly confined across a broad alluvial plain, although there are well-developed interaxial belts that are sandstone poor. Unconfined bed-load fluvial systems of the Canterbury Plain, New Zealand (Figure 7; Leckie, 1994), perhaps provide the closest modern analog to Merecure Unit A, although these modern systems principally carry boulders, gravel, and very coarse sandstone.

Table 1. Comparison of the stratigraphic nomenclature of this study with existing Corpoven sandstone nomenclature.
Oficina Unit A[edit]
Oficina Unit A is defined between flooding surfaces 68 and 70 (locally referred to as the T sandstone) and is interpreted as an example of a low-moderate sinuosity, mixed-load fluvial system. The unit varies from 11 to 28 m (37 to 92 ft) thick, and gross sandstone varies from 2 to 17 m (7 to 57 ft) thick. Discrete sandstone-rich axes that trend north-northeast with low to moderate sinuosity are interpreted as channel-point bar complexes (Figure 8). These sandstone-rich axes are confined between broad sandstone-poor areas that are attributed to floodplain deposition. Log-facies characters of the sandstone-rich channel belts are blocky and blocky-upward fining, suggesting predominantly aggradational bedding with minor lateral accretion processes (Figure 9). In contrast, log characters of the sandstone-poor areas are serrate and upward coarsening, consistent with suspension settling of floodplain muds and sporadic crevasse-splay deposition.
The approximately equal proportions of sandstone and shale, discrete sinuous sandstone-rich belts confined by mud-rich areas, and log-facies architecture are all consistent with deposition from a mixed-load fluvial system. The Tanana River near Fairbanks, Alaska, is a modern example of a low-to-moderate sinuosity, mixed-load fluvial system (Figure 10) and thus provides an appropriate analog for Oficina Unit A.
Oficina Unit B[edit]
Oficina Unit B, which is defined between flooding surfaces 63 and 68 and includes the S1-5 sandstones (PDVSA nomenclature), is interpreted as a sandy, braided fluvial system. The unit is 27 to 41 m (81 to 137 ft) thick, and gross sandstone varies from 5 to 29 m (16 to 95 ft).


The sandstone is stored primarily in a well-defined north-northwest-trending axis that is approximately 6 km wide and splits into a second channel axis in the north part of the field study (Figure 11). Sand-body geometry in the axial trend is low sinuosity, and the bedding architecture is aggradational, as indicated by the uniformly blocky gamma-ray and SP log patterns (Figure 12). The sandstone-dominant, blocky bedding architecture is attributed to deposition from migrating transverse and longitudinal bar forms that are typical of sandy, braided river systems. The well-defined mud-rich areas of this interval are characterized by uniformly serrate log packages and are interpreted as interchannel floodplain facies.
The external sand-body distribution and internal bedding architecture of the Oficina Unit B resemble that of a sandy, braided fluvial system that is confined by stable (vegetated?) floodplains. The modern sandy, braided William River in Canada (Figure 13; Miall, 1992) is regarded as a possible analog.
Structural Complexity[edit]
Because of its proximity to the craton or, conversely, its considerable distance from the thrust-and-fold belt, structure in the Arecuna area was historically thought of as simple and resulting from regional extension. Acquisition of the 3-D seismic data revealed a much more complex structural picture, however, and the 3-D seismic data proved essential to resolving the structural complexity that allowed accurate horizontal-well design. Nine key seismic-reflection events were identified (Figure 4), tied by synthetic seismograms to wellbore-defined stratigraphic horizons, and mapped throughout the data volume. Nine wells, all having sonic and density logs and some having check-shot surveys, were used to generate the synthetic tie between seismic and well control. Depth-structure maps were generated for each of the major stratigraphic units, providing the fundamental control surfaces for designing horizontal-well trajectories.


The depth map on FS 70 illustrates the structural trends and faulting pattern of the field area (Figure 14). The map reveals numerous fault-bounded blocks that display variable degrees of dip and orientation, although structural strike is generally east-west. The variability in structural orientations resulted from multiple episodes of faulting, with the largest faults oriented east-west and generally south-dipping. Throw on the main fault is variable, but generally 45-60 m (150-200 ft). This main fault provides the trap for the hydrocarbons in the northern half of the field area. The trapping mechanism for oil in the southeastern part of the field is another fault located south of the study area. The main fault in the center of the field is accompanied by a variety of parallel and antithetic faults, with fault throws typically on the order of 15 m (50 ft). A second set of smaller-scale faults is oriented north-northwest-south-southeast and dips mostly southwest. Although highly variable, fault throw is generally 3-15 m (10-50 ft), but locally can be as much as 30 m (100 ft).
The faulting pattern suggests that there were two main episodes of extension. The north-northwest-south-southeast-oriented fault set appears to be the oldest and was caused by regional extension of the basin (including basement). Bending at the basin rim probably caused the younger east-west fault set, but regional right-lateral strike-slip motion caused by collision of the South American and Caribbean Plates is superimposed on the younger fault set. The large structural low on the south side of the main east-west fault provides evidence of right-lateral shear caused by extensional forces at the fault bend (Figure 14). Several of the small normal faults appear to have been displaced by left-lateral shear, but this apparent displacement is misleading because the dip-slip movement is much greater than the strike-slip motion.
References[edit]
External links[edit]
| find literature about Arecuna field |