Difference between revisions of "Midale water saturation and pore geometry"
m (Matt moved page Effect of pore geometry on Sw in midale rocks to Effect of pore geometry on Sw in Midale rocks: case) |
Cwhitehurst (talk | contribs) m (added Category:Treatise Handbook 3 using HotCat) |
||
| (23 intermediate revisions by 3 users not shown) | |||
| Line 6: | Line 6: | ||
| part = Predicting the occurrence of oil and gas traps | | part = Predicting the occurrence of oil and gas traps | ||
| chapter = Predicting reservoir system quality and performance | | chapter = Predicting reservoir system quality and performance | ||
| − | | frompg = 9- | + | | frompg = 9-144 |
| − | | topg = 9- | + | | topg = 9-144 |
| author = Dan J. Hartmann, Edward A. Beaumont | | author = Dan J. Hartmann, Edward A. Beaumont | ||
| link = http://archives.datapages.com/data/specpubs/beaumont/ch09/ch09.htm | | link = http://archives.datapages.com/data/specpubs/beaumont/ch09/ch09.htm | ||
| Line 14: | Line 14: | ||
| isbn = 0-89181-602-X | | isbn = 0-89181-602-X | ||
}} | }} | ||
| − | ==Log response and | + | ==Log response and S<sub>w</sub>== |
| − | Variations in pore geometry have the expected effect on log responses and water | + | Variations in pore geometry have the expected effect on log responses and [[water saturation]]s (S<sub>w</sub>). The Midale vuggy beds in a cored field well consist of interbeds of [[packstone]] and [[mudstone]]. [[:file:predicting-reservoir-system-quality-and-performance_fig9-103.png|Figure 1]] is a [[Pickett plot construction|Pickett plot]] for the Midale vuggy beds from an example well in Weyburn field. Data points cluster around higher [[Basic_open_hole_tools#Resistivity|resistivities]] for packstones (group A) and lower resistivities for mudstones (group B), reflecting the higher water saturations of the mudstones. |
| − | |||
| − | |||
==Buckles plot== | ==Buckles plot== | ||
| − | + | <gallery mode=packed heights=200px widths=200x> | |
| + | predicting-reservoir-system-quality-and-performance_fig9-103.png|{{figure number|1}}Pickett plot for the Midale vuggy beds from an example well in Weyburn field. Copyright: Coalson et al.;<ref name=Coalson1994>Coalson, E. B., S. M. Goolsby, and M. H. Franklin, 1994, Subtle seals and fluid-flow barriers in carbonate rocks, in J. C. Dolson, M. L. Hendricks, and W. A. Wescott, eds., Unconformity Related Hydrocarbons in Sedimentary Sequences: RMAG Guidebook for Petroleum Exploration and Exploitation in Clastic and Carbonate Sediments, p. 45–58.</ref> courtesy RMAG. | ||
| + | Predicting-reservoir-system-quality-and-performance fig9-102.png|{{figure number|2}}Illustration of (A) packstones that are meso- to macroporous and (B) micro- to mesoporous mudstones. From Coalson et al.;<ref name=Coalson1994 /> courtesy RMAG. | ||
| + | predicting-reservoir-system-quality-and-performance_fig9-104.png|{{figure number|3}}Buckles plot for the Weyburn well. Copyright: Coalson et al.;<ref name=Coalson1994 /> courtesy RMAG. | ||
| + | </gallery> | ||
| − | + | As shown on [[:File:Predicting-reservoir-system-quality-and-performance fig9-102.png|Figure 2]], mudstones (B) are [[Wikipedia:Microporous material|micro]]- to [[Wikipedia:Mesoporous material|mesoporous]]; packstones (A) are meso- to [http://en.wiktionary.org/wiki/macroporous macroporous]. The mudstones have more pores with smaller pore throats than the packstones. This means mudstones have greater pore surface area and higher immobile S<sub>w</sub>. As a consequence, S<sub>w</sub> values for mudstones are higher at any given elevation in the oil column. | |
| − | + | [[:file:predicting-reservoir-system-quality-and-performance_fig9-104.png|Figure 3]] is a [[Buckles plot]] for the Weyburn well. The hyperbolic curves represent equal values of S<sub>w</sub> × porosity (Φ). Points from the same pore type that fall along a hyperbolic curve are at immobile S<sub>w</sub>. Curves with higher values represent higher immobile S<sub>w</sub>. | |
| − | [ | + | On the plot, data for packstones (A), except for point 8, fall on a hyperbolic curve with a value between 100 and 300. This indicates these beds are at [http://petrowiki.org/Glossary%3AIrreducible_water_saturation immobile (irreducible) water saturations]. Point 8 is from a transition zone. Mudstones (B) also are at immobile water saturations but fall on a hyperbolic curve with higher numbers, between 1000 and 1300. |
==See also== | ==See also== | ||
* [[Evaluation of trap type]] | * [[Evaluation of trap type]] | ||
* [[Weyburn field location and trap problem]] | * [[Weyburn field location and trap problem]] | ||
| − | * [[ | + | * [[Midale lithofacies and distribution]] |
* [[Midale porosity, pore geometries, and petrophysics]] | * [[Midale porosity, pore geometries, and petrophysics]] | ||
* [[Weyburn seal capacity]] | * [[Weyburn seal capacity]] | ||
| − | * [[ | + | * [[Midale seal capacity and trap type]] |
| + | |||
| + | ==References== | ||
| + | {{reflist}} | ||
==External links== | ==External links== | ||
| Line 44: | Line 49: | ||
[[Category:Predicting the occurrence of oil and gas traps]] | [[Category:Predicting the occurrence of oil and gas traps]] | ||
[[Category:Predicting reservoir system quality and performance]] | [[Category:Predicting reservoir system quality and performance]] | ||
| + | [[Category:Treatise Handbook 3]] | ||
Latest revision as of 17:01, 12 April 2022
| Exploring for Oil and Gas Traps | |

| |
| Series | Treatise in Petroleum Geology |
|---|---|
| Part | Predicting the occurrence of oil and gas traps |
| Chapter | Predicting reservoir system quality and performance |
| Author | Dan J. Hartmann, Edward A. Beaumont |
| Link | Web page |
| Store | AAPG Store |
Log response and Sw
Variations in pore geometry have the expected effect on log responses and water saturations (Sw). The Midale vuggy beds in a cored field well consist of interbeds of packstone and mudstone. Figure 1 is a Pickett plot for the Midale vuggy beds from an example well in Weyburn field. Data points cluster around higher resistivities for packstones (group A) and lower resistivities for mudstones (group B), reflecting the higher water saturations of the mudstones.
Buckles plot
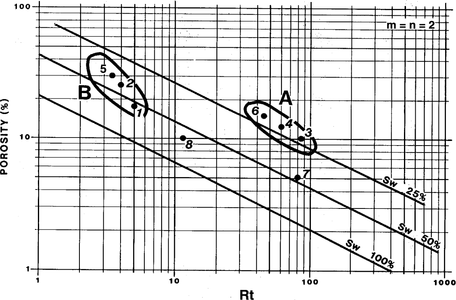
Figure 1 Pickett plot for the Midale vuggy beds from an example well in Weyburn field. Copyright: Coalson et al.;[1] courtesy RMAG.
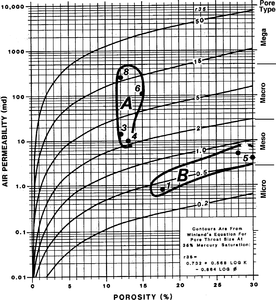
Figure 2 Illustration of (A) packstones that are meso- to macroporous and (B) micro- to mesoporous mudstones. From Coalson et al.;[1] courtesy RMAG.
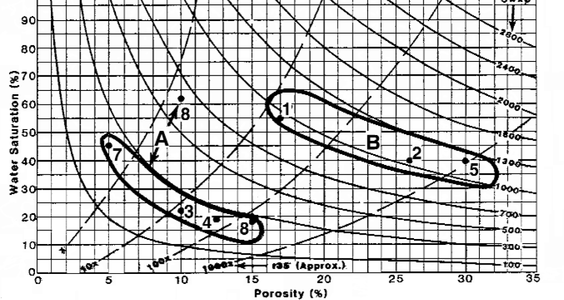
Figure 3 Buckles plot for the Weyburn well. Copyright: Coalson et al.;[1] courtesy RMAG.


As shown on Figure 2, mudstones (B) are micro- to mesoporous; packstones (A) are meso- to macroporous. The mudstones have more pores with smaller pore throats than the packstones. This means mudstones have greater pore surface area and higher immobile Sw. As a consequence, Sw values for mudstones are higher at any given elevation in the oil column.
Figure 3 is a Buckles plot for the Weyburn well. The hyperbolic curves represent equal values of Sw × porosity (Φ). Points from the same pore type that fall along a hyperbolic curve are at immobile Sw. Curves with higher values represent higher immobile Sw.
On the plot, data for packstones (A), except for point 8, fall on a hyperbolic curve with a value between 100 and 300. This indicates these beds are at immobile (irreducible) water saturations. Point 8 is from a transition zone. Mudstones (B) also are at immobile water saturations but fall on a hyperbolic curve with higher numbers, between 1000 and 1300.
See also
- Evaluation of trap type
- Weyburn field location and trap problem
- Midale lithofacies and distribution
- Midale porosity, pore geometries, and petrophysics
- Weyburn seal capacity
- Midale seal capacity and trap type
References
- ↑ 1.0 1.1 1.2 Coalson, E. B., S. M. Goolsby, and M. H. Franklin, 1994, Subtle seals and fluid-flow barriers in carbonate rocks, in J. C. Dolson, M. L. Hendricks, and W. A. Wescott, eds., Unconformity Related Hydrocarbons in Sedimentary Sequences: RMAG Guidebook for Petroleum Exploration and Exploitation in Clastic and Carbonate Sediments, p. 45–58.
External links
| find literature about Midale water saturation and pore geometry |