Search results
Jump to navigation
Jump to search
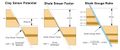
File:GumelarFigure6.jpg ...for estimating clay smears in the fault plane. (a) Potential Clay Smear; (b) Shale Gouge Ratio; (c) Shale Smear Factor (redrawn from Yielding, 1997).(1,347 × 565 (92 KB)) - 17:25, 29 September 2021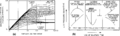
File:Pressure-transient-testing fig2.png (a) Derivative type curve used to match derivatives of test data. (b) Shapes of derivatives of test data for various reservoir conditions.(1,946 × 591 (34 KB)) - 18:23, 14 January 2014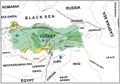
File:M106Ch13Fig02.jpg ...1. B. Firat, 2. B. Kayaköy, 3. B. Kozluca, 4. B. Malatepe, 5. B. Migo, 6. B. Raman, 7. Barbeş, 8. Baysu, 9. Beşikli, 10. Beyçayir, 11. Beykan, 12. B(700 × 491 (61 KB)) - 19:34, 5 July 2016
File:Well-completions fig2.png Wellbore diagram of (a) a screen and liner completion and (b) a cement liner completion.(946 × 863 (40 KB)) - 21:20, 14 January 2014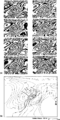
File:Three-dimensional-seismic-method fig2.png {{copyright|a marine 3-D survey and (b) a time-structure map of a marker horizon derived from the 3-D volume of mi (a) Selected time slices. Copyright: a marine 3-D survey and (b) a time-structure map of a marker horizon derived from the 3-D volume of mi(1,338 × 2,684 (369 KB)) - 19:36, 14 January 2014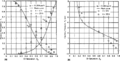
File:Conducting-a-reservoir-simulation-study-an-overview fig2.png (a) Pseudo-relative permeability and (b) capillary pressure curves calculated for two-layer thicknesses compared to(1,939 × 978 (97 KB)) - 18:46, 14 January 2014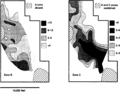
File:Subsurface-maps fig6.png Porosity thickness (ϕH) maps for the B and C zones from the San Andres Formation reservoir, Jordan field, Ector an(1,944 × 1,484 (237 KB)) - 20:42, 14 January 2014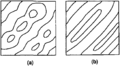
File:Using-and-improving-surface-models-built-by-computer fig5.png ...st algorithms weight data isotropically and creat circular surface forms. (b) Single direction bias forces elliptical weighting, allowing surface form t(923 × 510 (11 KB)) - 22:32, 13 January 2014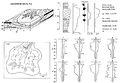
File:M31F6.jpg ...ain. From Deltaic environments of deposition, 1981, Coleman, J. M., and D. B. Prior, in AAPG Memoir 31.(1,467 × 1,013 (318 KB)) - 19:40, 15 August 2014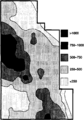
File:Subsurface-maps fig7.png Cumulative oil production map for the A, B, C, and D zones from the San Andres Formation reservoir, Jordan field, Ecto(944 × 1,353 (62 KB)) - 20:42, 14 January 2014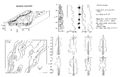
File:M31F3.jpg ...hs). From Deltaic environments of deposition, 1981, Coleman, J. M., and D. B. Prior, in AAPG Memoir 31.(2,941 × 1,884 (830 KB)) - 19:02, 15 August 2014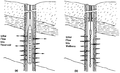
File:Well-completions fig9.png Two perforating methods: (a) Perforating overbalanced with a casing gun and (b) perforating underbalanced with a thrutubing gun.(1,880 × 1,143 (110 KB)) - 21:20, 14 January 2014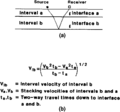
File:Mapping-with-two-dimensional-seismic-data fig4.png ...ay paths, intervals, and interfaces used to help explain the Dix formula. (b) The Dix formula for calculating interval velocities, which assumes that in(907 × 849 (12 KB)) - 19:36, 14 January 2014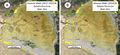
File:Figure3MancosCommRept.jpg ...ed) wells drilled in Mancos pools. A) In the period 2017-2020 (125 wells). B) In 2020 alone (11 wells). Contours show the top Dakota elevation, simplifi(1,615 × 744 (818 KB)) - 20:51, 14 April 2021
File:AlHawajAlQahtaniFigure1.jpg ...folded layer (Sub-Andean Zone, Bolivia), showing a) the deformed state and b) the restored state. c) Distribution of maximum principal stress that resul(979 × 447 (95 KB)) - 20:44, 8 November 2021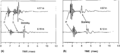
File:Full-waveform-acoustic-logging fig1.png FWAL microseismograms recorded (a) at two source-receiver separations and (b) In a “soft” formation at two source-receiver separations.(1,948 × 865 (19 KB)) - 17:49, 13 January 2014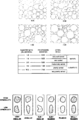
File:Core-description fig2.png ...t for sorting and sorting classes. (Modified from Pettijohn et al. 1987.) (b) Comparison chart for roundness and sphericity. (Modified from Powers, 1953(946 × 1,441 (37 KB)) - 22:38, 13 January 2014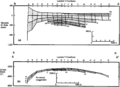
File:Geological-cross-sections fig1.png (a) Stratigraphic and (b) structural cross sections of the Ranger Formation in the Long Beach unit o(1,958 × 1,420 (129 KB)) - 15:32, 14 January 2014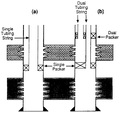
File:Well-completions fig4.png Wellbore diagram of (a) a casing-tubing dual completion and (b) a completion with dual packers and dual tubing strings.(953 × 901 (48 KB)) - 21:20, 14 January 2014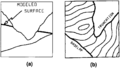
File:Using-and-improving-surface-models-built-by-computer fig12.png ...ed by the higher surface. (a) Cross section showing proper relationships. (b) Map showing surface contours and lines of baselap and truncation.(931 × 530 (11 KB)) - 22:32, 13 January 2014


