Borehole imaging devices
| Development Geology Reference Manual | |

| |
| Series | Methods in Exploration |
|---|---|
| Part | Wireline methods |
| Chapter | Borehole imaging devices |
| Author | Stefan M. Luthi |
| Link | Web page |
| Store | AAPG Store |
Borehole imaging devices are high resolution wireline tools that produce maps of physical measurements of the rocks exposed on the borehole wall. They are thus two-dimensional logs, with depth and azimuth as independent variables.
Three main imaging techniques are presently in use:
- Ultrasonic reflection
- Electrical scanning
- Optical scanning
Among these, the optical method is omitted from the following discussion because it is confined to boreholes with clear borehole fluids and is rarely used in the petroleum industry.
Table 1 summarizes the main characteristics of the two tools discussed in this article, and in the related articles in the See Also section. The currently available borehole image methods provide only semiquantitative physical measurements and therefore are not suitable for the estimation of bulk rock properties as is done with wireline logs. Because of the two-dimensional nature of borehole images, the principal information is structural, that is, it is pertinent to the geometrical arrangement of rock layers caused by sedimentary and tectonic forces. This makes borehole images powerful tools in the hands of petroleum geologists and reservoir engineers in determining lithofacies types, folds, faults, and fractures influencing reservoir compartmentalization, extent, and performance.
| Characteristic | Borehole Televiewer | Formation MicroScanner |
|---|---|---|
| Typical logging speed | 800 ft/hr (245 m/hr) | 1600 ft/hr (490 m/hr) |
| Borehole wall coverage | Full (360°) | Partial (depending on number of pads and runs) |
| Borehole size | 6–12 in. (15–30 cm) | 6–18 in. (15–46 cm) |
| Borehole muds | Best results in light muds | Conductive muds only |
| Typical Sampling Rates: | ||
| Vertical | 0.2–0.5 in. (5–12.5 mm) | 0.1 in. (2.5 mm) |
| Horizontal | 0.1 in. (2.5 mm) | 0.1–0.2 in. (2.5–5 mm) |
| Properties influencing measurement | Acoustic impedance contrasts; borehole geometry | Rock microresistivity |
| Shortcomings | Sensitive to borehole rugosity and drillmarks; sensitive to tool eccentering and borehole ellipticity | Resolution decreased by pad stand-off; irregular tool speed causes layer misalignment |
| Main applications | Fracture detection (orientation); borehole geometry; breakout detection (orientation) | Bedding types; fracture detection (orientation and width); fault detection (orientation) |
Borehole images are normally displayed in a depth and azimuth reference system, which corresponds to the projection of the cylindrical surface of a drill core onto a plane that is split by tradition along magnetic north. In this projection, an inclined planar feature such as a bedding surface, fracture, or fault shows up as a sinusoid. The minimum, or trough, of a sinusoid points in the direction of the dip azimuth, while the amplitude (divided by the borehole diameter) indicates the dip angle.
Most borehole images are digitized, either downhole or uphole, and are thus amenable to digital computer processing such as image enhancement (e.g., filtering, sharpening, and false coloring), higher level image analysis (e.g., feature recognition and extraction), and three-dimensional projections. Interactive graphic workstations are useful tools for manipulating and interpreting borehole images.
Ultrasonic reflection technique: the borehole televiewer
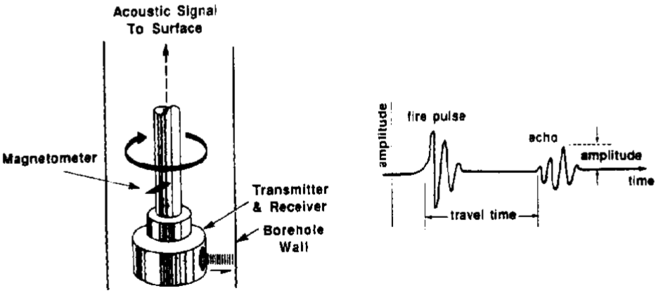
Figure 1. Borehole televiewer technique.[1]
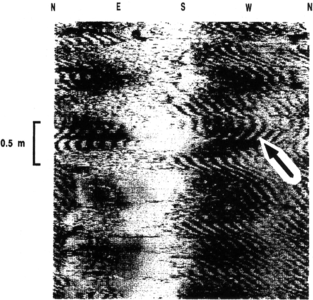
Figure 2. Drill marks (arrow) on borehole televiewer images.
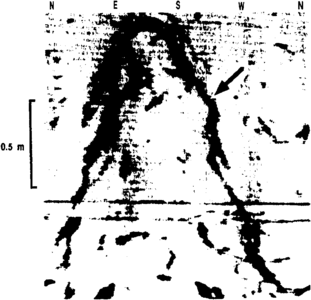
Figure 3. Borehole televiewer Image showing fracture (arrow) crossing the wellbore.
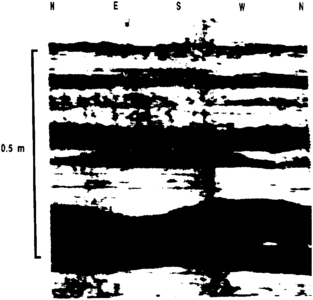
Figure 4. Borehole televiewer images showing shale layers (dark) intercalated with limestone layers (bright).
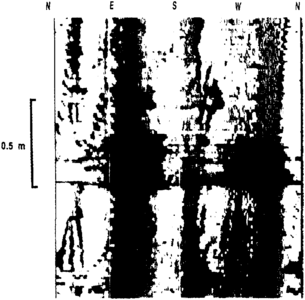
Figure 5. Borehole televiewer image showing breakouts (dark patches) at NNW and SSE.


Acoustic borehole televiewers all contain a rotating ultrasonic transducer that emits a pulse and receives the signal reflected by the borehole wall (Figure 1). The transducers are either focused or unfocused and have frequencies in the range of 200 kHz to 1 MHz; they typically perform 3 to 16 rotations per second. Orientation of the transducer is normally provided through a magnetometer. Two types of images can be obtained: one based on the reflected amplitude and one on the two-way traveltime. By convention, darker gray tones are used for lower reflected amplitudes and higher two-way traveltimes.
The borehole televiewer provides strictly a borehole wall surface measurement and as such is affected by rugosity, drill marks (Figure 2), borehole ellipticity, and tool eccentering. It is an effective tool when good hole conditions with relatively smooth borehole walls prevail. Reflected amplitude images are successfully used in the characterization of fractured reservoirs (Figure 3) and to a lesser degree for layered reservoir analysis (Figure 4). The transit time images provide an acoustic, full-circumference caliper of the borehole which is used for wellbore volume calculations, breakout analysis (Figure 5), and wellbore rugosity estimates.
Electrical borehole scanning: the formation microscanner
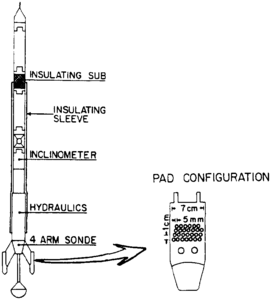
Figure 6 Formation MicroScanner technique.[2]
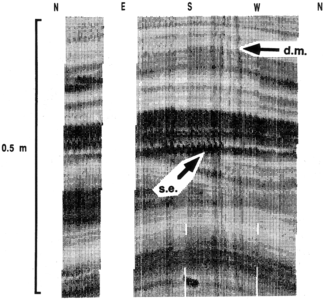
Figure 7 Formation MicroScanner images of cross-bedded sequence showing drill marks (d.m.) at WSW and sawtooth effects (s.e.) on some layers.
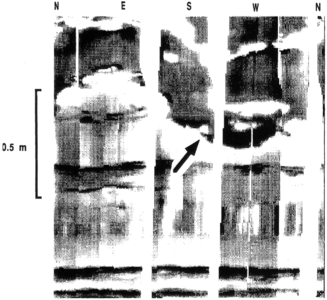
Figure 8 Formation MicroScanner images showing dipping unconformity at contact (arrow) of Cretaceous clastic rocks with Mississippian carbonates.
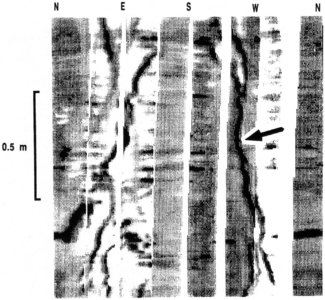
Figure 9 Formation MicroScanner images of open conductive fracture (arrow).
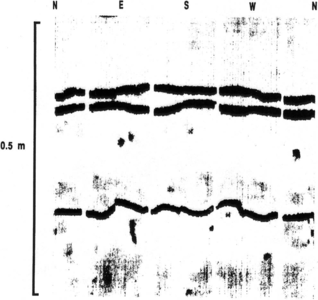
Figure 10 Formation MicroScanner images of stylolitic limestone.


Electrical borehole scanning is an extension of the dipmeter technique. In this method, a large number of closely spaced electrodes of 0.2-in. diameter are mounted on a conductive pad and pressed against the borehole wall. The amount of current emitted from each electrode is recorded as a function of azimuth and depth (Figure 6). The tool thus produces a microresistivity map. Currently on the market are versions with two and four imaging pads perpendicular to each other. The resulting image stripes are about 2.5 in. wide and are oriented azimuthally by a downhole magnetometer unit. In a 8.5-in. borehole, the four-pad Formation MicroScanner provides a 45% circumferential coverage. Repeat logging passes can often increase this percentage. By convention, darker gray tones are used for lower resistivities.
Formation MicroScanner images record changes in rock resistivity caused by variations in porosity and clay content of a small rock volume in the vicinity of the borehole wall. Increased pad stand-off due to mudcake buildup on the borehole wall may decrease the spatial resolution, while abrupt changes in tool movement may produce a local misalignment or sawtooth effect in the layers (Figure 7). Important bedding types and surfaces can be identified and measured for their dip and azimuth (Figure 8), as are fractures (Figure 9) and stylolites (Figure 10). Faults are often readily recognized on Formation MicroScanner images because of the offset of rock types across the fault plane.
See also
- Difficult lithologies
- Dipmeters
- Formation evaluation of naturally fractured reservoirs
- Basic open hole tools
- Basic tool table
- Determination of water resistivity
- Preprocessing of logging data
- Wireline formation testers
- Basic cased hole tools
- Standard interpretation
- Quick-look lithology from logs
References
- ↑ Zemanek, J., R. L. Caldwell, E. E. Glenn, S. V. Holcomb, L. J. Norton, and A. J. D. Straus, 1969, The Borehole Televiewer—a new logging concept for fracture location and other types of borehole inspection: Journal of Petroleum Technology, v. 21, p. 762–774, DOI: 10.2118/2402-PA.
- ↑ Ekstrom, M. P., C. Dahan, M.-Y. Chen, P. Lloyd, and D. Rossi, 1987, Formation imaging with microelectrical scanning arrays: The Log Analyst, v. 28, p. 294–306.
External links
| find literature about Borehole imaging devices |