Search results
Jump to navigation
Jump to search
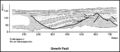
File:M91Ch13FG94.JPG ...on in areas with thick delta sequences and mobile substrates such as shale or salt. This example is from Upper Triassic deltaic sediments exposed in the(800 × 345 (49 KB)) - 21:41, 29 April 2015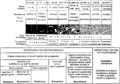
File:Thin-section-analysis fig2.png ...9) and (b) Dunham (1962), both based on textures observed in hand specimen or thin section. In Folk's scheme, the black pattern represents lime mud matri(1,959 × 1,366 (182 KB)) - 21:07, 14 January 2014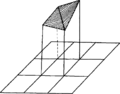
File:Using-and-improving-surface-models-built-by-computer fig19.png The cell's corners are defined by grid nodes. The top is defined by two or more planes passing through the node z values and lie inside the polygon. T(817 × 641 (22 KB)) - 22:32, 13 January 2014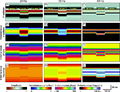
File:AAPGBullFeb2013ZengFigure4.JPG ...ulated with 90deg Ricker wavelets of 20-, 35-, and 80-Hz peak frequencies (or 26-, 45.5-, and 104-Hz predominant frequencies, respectively). No noise is(800 × 613 (224 KB)) - 18:22, 30 June 2014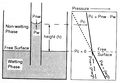
File:Charles-l-vavra-john-g-kaldi-robert-m-sneider capillary-pressure 2.jpg The wetting phase rises above the original or free surface in the capillary tube experiment until adhesive and gravitatio(1,200 × 828 (279 KB)) - 17:41, 13 September 2013
File:Geological-cross-sections fig2.png ...o make the cross section more compact. The left track of each log is an SP or gamma ray trace and the right track is a resistivity trace. (From Slatt et(1,921 × 1,041 (171 KB)) - 15:32, 14 January 2014
File:Conversion-of-well-log-data-to-subsurface-stratigraphic-and-structural-information fig5.png ...les. This method assumes a constant radius of curvature (constant increase or decrease in deviation between survey points). (b) Minimum curvature method(1,968 × 1,106 (119 KB)) - 16:38, 14 January 2014
File:Lithofacies-and-environmental-analysis-of-clastic-depositional-systems fig3.png Models of major depositional environments. The curve on the left shows the SP or gamma ray response and the curve on the right shows the relative grain size(1,950 × 1,563 (201 KB)) - 21:37, 13 January 2014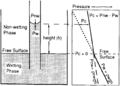
File:Capillary-pressure fig2.png The wetting phase rises above the original or free surface in the capillary tube experiment until adhesive and gravitatio(947 × 675 (25 KB)) - 18:22, 14 January 2014
File:M114CH10FG02.jpg ...structural spillpoint and the hydrocarbon–water contact) and (B) shows to or deeper than the structural spillpoint (presented as the vertical distance b(641 × 652 (54 KB)) - 23:02, 8 January 2019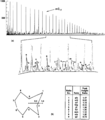
File:Oil-and-condensate-analysis fig5.png ...fferent attenuations, (b) as star diagrams of selected peak height ratios, or (c) as data tables of peak height ratios. The star diagram is a polar plot(1,942 × 2,226 (120 KB)) - 17:17, 14 January 2014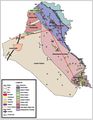
File:M106Ch12Fig03.jpg ...owing major structural features. Fields and significant wells with oil and/or gas shows are shown; numbers refer to Tables 1–5 in [[Iraq petroleum geol(700 × 902 (78 KB)) - 13:57, 12 May 2016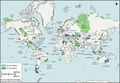
File:GiacomoneEtAlFigure1.jpg ...super basins (those with less than 5 billion BOE of cumulative production or remaining recoverable oil and gas) are shown in light blue. DwGoM = deep-wa(868 × 600 (145 KB)) - 20:51, 28 October 2021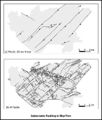
File:M91Ch13FG93.JPG ...field, United Kingdom. In map (a), only faults with throws of 20 m (64 ft) or more are shown. These are equivalent to faults that are detectable by seism(600 × 704 (72 KB)) - 21:40, 29 April 2015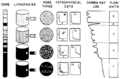
File:Flow-units-for-reservoir-characterization fig1.png ...unit, it is permissible to define a flow unit that exhibits only weak flow or no flow through it. This property of flow units makes it possible to use a(1,487 × 976 (91 KB)) - 23:13, 14 January 2014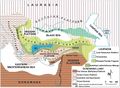
File:M106Ch13Fig01.jpg ...en recognized and described which correspond to either a continental block or a suture zone that is amalgamated as a result of the Neo-Tethyan collision(700 × 513 (90 KB)) - 19:29, 5 July 2016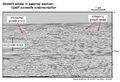
File:ST53Part01Pg11B.jpg ...rata are generally not present above the fold crest, but are folded in one or more limbs of the structure. In this seismic section, growth strata onlap t(750 × 511 (141 KB)) - 16:33, 28 July 2015
File:Multivariate-data-analysis fig2.png ...and 3). Then, combine the two nearest groups by either joining two samples or aggregating a third sample to the previous group of two (1 is aggregated to(949 × 348 (7 KB)) - 00:51, 14 January 2014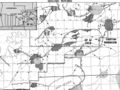
File:Mth14ch04f01.jpg ...of water. Dark gray indicates oil fields. Light gray refers to salt domes or tabular salt. From Results and Conclusions of a Horizontal-drilling Program(700 × 525 (111 KB)) - 16:00, 7 December 2015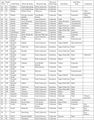
File:M106Ch12Table3a.jpg ...), marl, dense limestone, evaporite-shale, and evaporite-marl. Alternative or old reservoir names provided in comments column. Field number refers to loc(700 × 896 (147 KB)) - 15:36, 12 May 2016


