Search results
Jump to navigation
Jump to search
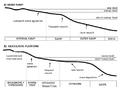
File:3.png ...ing facies association A and B, by Tomassini et al. (2014). A) mixed ramp. B) siliciclastic platform.(480 × 357 (68 KB)) - 16:50, 26 June 2015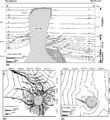
File:DiapirDiagram.JPG ...contour map drawn on the J horizon. (c) Structure contour map drawn on the B horizon. From AAPG Bulletin, V. 91, No. 3 (March 2007), P. 343-363, by Hong(800 × 870 (270 KB)) - 17:59, 2 January 2015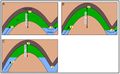
File:GumelarFigure8.jpg ...xamples of leaks from a major structure. HCH in a) has a lower height than b). c) has a spill point value that is above the crest depth so that no leaka(870 × 540 (75 KB)) - 20:33, 28 October 2021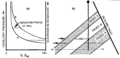
File:Fluid-contacts fig4.png .... Sharp changes in saturation correspond to elevations of facies changes. (b) Oil-water contact corresponding to capillary pressure curves. The free wat(1,924 × 933 (108 KB)) - 01:52, 14 January 2014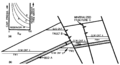
File:Fluid-contacts fig5.png ...on difference between contacts 1 and 2. The displacement pressure of fault B results in the elevation difference between contacts 1 and 3. The displacem(1,908 × 1,034 (76 KB)) - 01:52, 14 January 2014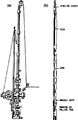
File:Workovers fig5.png Wireline equipment, (a) Lubricator, (b) Typical string.(933 × 1,434 (53 KB)) - 21:50, 14 January 2014
File:Applied-paleontology fig17-29.png ...e adapted from Berggren et al., 1985a, <xref ref-type="bibr" rid="ch17r13">b}} ...e adapted from Berggren et al., 1985a, <xref ref-type="bibr" rid="ch17r13">b.(773 × 1,259 (209 KB)) - 16:03, 18 January 2014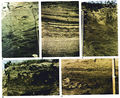
File:M31F5.jpg ...its. From Deltaic environments of deposition, 1981, Coleman, J. M., and D. B. Prior, in AAPG Memoir 31.(1,152 × 941 (941 KB)) - 19:33, 15 August 2014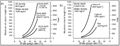
File:GumelarFigure9.jpg a) HCH from constant burial depth & b) using the formula Bretan, P. et al (2003).(828 × 316 (78 KB)) - 20:42, 28 October 2021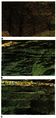
File:M31F2.jpg ...ons. From Deltaic environments of deposition, 1981, Coleman, J. M., and D. B. Prior, in AAPG Memoir 31.(365 × 772 (175 KB)) - 18:56, 15 August 2014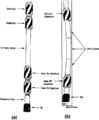
File:Wellbore-trajectory fig7.png (a) Packed bottom hole assembly, (b) Fulcrum effect for build angle.(900 × 1,089 (37 KB)) - 21:19, 14 January 2014
File:H4CH12FG11.JPG ...2012, Hicks, P. J. Jr., C. M. Fraticelli, J. D. Shosa, M. J. Hardy, and M. B. Townsley, in Peters, Kenneth E., David J. Curry, and Marek Kacewicz, eds.,(600 × 322 (73 KB)) - 21:40, 13 July 2015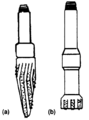
File:Fishing fig7.png (a) Tapered mill, (b) Flat mill.(595 × 801 (17 KB)) - 01:50, 14 January 2014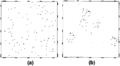
File:Introduction-to-contouring-geological-data-with-a-computer fig1.png (a) Random points. (b) Clustered points.(947 × 524 (13 KB)) - 22:06, 13 January 2014
File:Seismic-data-acquisition-on-land fig5.png (a) Off end shooting. (b) Split spread shooting.(1,669 × 506 (9 KB)) - 16:16, 14 January 2014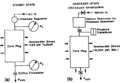
File:Permeability fig4.png Schematic diagram of (a) steady-state and (b) unsteady-state apparatus.(934 × 647 (32 KB)) - 18:02, 14 January 2014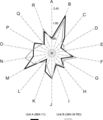
File:Mth14ch02f08.jpg ...Units A and B are not in fluid communication with each other, Units A and B appear to represent separate reservoir compartments (Suhas Talukdar, Core L(400 × 465 (28 KB)) - 20:19, 4 December 2015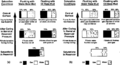
File:Core-alteration-and-preservation fig1.png {{copyright|reservoir to surface. (a)Oil-productive formation. (b) Gas-productive formation. (Courtesy of Core Laboratories, a Division of We ...d contents. Copyright: reservoir to surface. (a)Oil-productive formation. (b) Gas-productive formation. (Courtesy of Core Laboratories, a Division of We(1,954 × 1,054 (65 KB)) - 22:38, 13 January 2014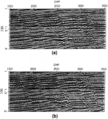
File:Seismic-migration fig6.png (a) Unmigrated and (b) migrated stack of DMO-processed data from the Gulf of Mexico.(1,007 × 1,114 (690 KB)) - 19:35, 14 January 2014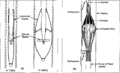
File:Production-logging fig4.png Two types of flowmeters, (a) Full bore flowmeter, (b) Diverting basket type flowmeter.(1,963 × 1,194 (48 KB)) - 16:37, 14 January 2014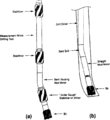
File:Wellbore-trajectory fig6.png (a) Steerable bottom hole assembly, (b) Kicking off with a bent sub and straight mud motor.(890 × 974 (33 KB)) - 21:19, 14 January 2014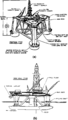
File:Offshore-rigs fig3.png Semisubmersible rigs, (a) Pontoon type semisubmersible. (b) Twin hull semisubmersible. (From Whittaker, 1985.)(942 × 1,663 (39 KB)) - 17:16, 14 January 2014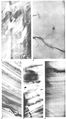
File:M31F27.jpg ...its. ote the lack of disturbance in these deposits. Coleman, J. M., and D. B. Prior, 1981, Deltaic environments of deposition ''in'' P. A. Scholle and D(760 × 1,372 (583 KB)) - 18:23, 18 August 2014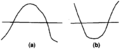
File:Using-and-improving-surface-models-built-by-computer fig8.png Cross sections showing that surfaces that intersect due to (a) baselap or (b) truncation will incorrectly cross one another.(837 × 343 (9 KB)) - 22:32, 13 January 2014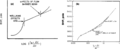
File:Pressure-transient-testing fig5.png (a) Typical buildup curve shape with flow barrier, (b) Doubling of slope on Horner plot for well near barrier.(1,955 × 806 (48 KB)) - 18:23, 14 January 2014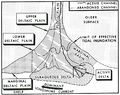
File:M31F1.jpg ...tem. From Deltaic environments of deposition, 1981, Coleman, J. M., and D. B. Prior, in AAPG Memoir 31.(744 × 591 (256 KB)) - 18:15, 15 August 2014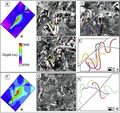
File:AlHawajAlQahtaniFigure6.jpg ...7] A) Faulted horizon surface. The small black box is the location of B-E. B-D) Channels lateral geometry on different horizon levels. E) Restoration us(468 × 439 (80 KB)) - 21:05, 8 November 2021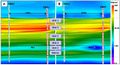
File:AlsaudKatterbauerFigure5.jpg ...se EM resistivity image between OBS1 and OBS2. (A) before water injection (B) After four months of water injection(624 × 338 (79 KB)) - 22:14, 3 February 2022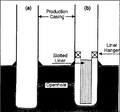
File:Well-completions fig1.png Wellbore diagram of (a) an open hole completion and (b) a slotted liner completion.(947 × 882 (40 KB)) - 21:20, 14 January 2014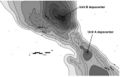
File:Mth14ch02f07.jpg ...depositional accumulations, an interpretation consistent with Units A and B representing separate compartments with different oil-water contacts. From(700 × 449 (53 KB)) - 19:56, 4 December 2015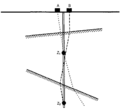
File:Checkshots-and-vertical-seismic-profiles fig3.png The source position (A or B) should be chosen so that the travel path to each receiver is as nearly ver(945 × 875 (8 KB)) - 21:28, 13 January 2014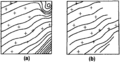
File:Using-and-improving-surface-models-built-by-computer fig1.png ...he same surface data. (a) Unconstrained extrapolation into nondata areas. (b) Contours constrained to areas near data.(923 × 479 (31 KB)) - 22:32, 13 January 2014
File:Well-completions fig10.png Qualitative description of perforations using (a) a casing gun and (b) a thru-tubing gun.(901 × 556 (29 KB)) - 21:20, 14 January 2014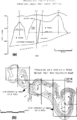
File:Subsurface-maps fig4.png (a) Cross section and (b) net pay Isopach map of the Strachan gas field, western Canada. Contour Int(890 × 1,386 (78 KB)) - 20:42, 14 January 2014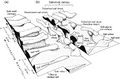
File:AlHawajAlQahtaniFigure5.jpg Schematic 3D geometry of salt structures rising from a) line sources and b) point sources. Note the complexity in all directions resulting from salt d(475 × 311 (57 KB)) - 21:01, 8 November 2021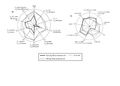
File:AlfraihAlSaifFigure7.jpg A spider diagram illustrating source parameters. A) Aliphatic hydrocarbons, b) aromatic hydrocarbons from oil inclusions and crude oil.(2,100 × 1,500 (487 KB)) - 19:15, 31 January 2022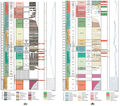
File:M114CH01FG02.jpg Generalized pre-Mesozoic stratigraphic column for (A) northwest and (B) east-central Saudi Arabian Basin. From AAPG Memoir 114: Petroleum Systems(700 × 619 (117 KB)) - 19:52, 31 December 2018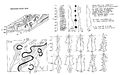
File:M31F4.jpg ...its. From Deltaic environments of deposition, 1981, Coleman, J. M., and D. B. Prior, in AAPG Memoir 31.(1,464 × 916 (326 KB)) - 19:19, 15 August 2014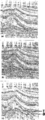
File:Three-dimensional-seismic-method fig1.png {{copyright|a marine 3-D survey. (b) The corresponding 2-D migrated section. (c) The 3-D migrated section. (Dat (a) A CMP-stacked section. Copyright: a marine 3-D survey. (b) The corresponding 2-D migrated section. (c) The 3-D migrated section. (Dat(943 × 2,518 (143 KB)) - 19:36, 14 January 2014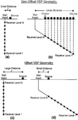
File:Checkshots-and-vertical-seismic-profiles fig4.png Examples of the source-receiver positions involved in (a and b) zero offset and (c and d) offset VSP recording geometries.(942 × 1,445 (56 KB)) - 21:29, 13 January 2014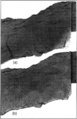
File:Sem-xrd-cl-and-xf-methods fig6.png (a) X-ray fluoroscopy slab photograph and (b) plane light slab photograph of a Pennsylvanian sandstone from Oklahoma.(1,034 × 1,598 (1.16 MB)) - 22:29, 14 January 2014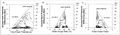
File:GumelarFigure7.jpg ...ation ability for sealing capacity in reservoir (a) Clay Smear Potential; (b) Shale Gouge Ratio; (c) Shale Smear Factor (Yielding et al, 1997).(880 × 256 (64 KB)) - 17:25, 29 September 2021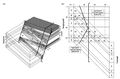
File:GumelarFigure5.jpg ...mple normal fault with increasing linear displacement from left to right. (B) Generic juxtaposition diagram with the order of the footwall completely of(738 × 488 (85 KB)) - 23:10, 28 September 2021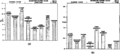
File:Evaluating-tight-gas-reservoirs fig3.png Histograms showing (a) average porosity values and (b) average permeability values for cored tight gas reservoir facies. (From Mo(1,964 × 879 (37 KB)) - 18:47, 14 January 2014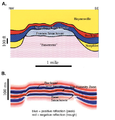
File:Reef1.png (A) Geologic model used in seismic modeling of Figure 7 and (B) seismic section of the structure at Appleton field (modified from Balch an(471 × 491 (248 KB)) - 16:08, 20 November 2014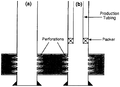
File:Well-completions fig3.png Wellbore diagram of (a) a perforated completion and (b) a single completion inside perforated casing.(940 × 683 (34 KB)) - 21:20, 14 January 2014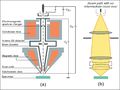
File:Figure-1.jpg ...f the GEMINI electron column (a) and the electron beam path in the column (b). From DOI: 10.1306/13391699M1023580(961 × 723 (47 KB)) - 17:17, 15 August 2014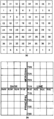
File:Land-description-and-maps fig1.png ...icial plat of township sectionized and numbered, with adjoining sections. (b) Official plan of numbering Congressional Townships from meridians and base(964 × 2,127 (81 KB)) - 16:15, 14 January 2014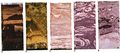
File:M31F14v2.jpg ...ng the uppermost part of the channel-fill deposits. Coleman, J. M., and D. B. Prior, 1981, Deltaic environments of deposition in P. A. Scholle and D. Sp(1,134 × 503 (75 KB)) - 15:16, 18 August 2014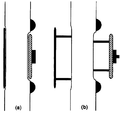
File:Wireline-formation-testers fig1.png Wireline formation tester. (a) Retracted configuration (tool closed). (b) Set configuration (tool set).(924 × 867 (21 KB)) - 21:44, 14 January 2014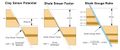
File:GumelarFigure6.jpg ...for estimating clay smears in the fault plane. (a) Potential Clay Smear; (b) Shale Gouge Ratio; (c) Shale Smear Factor (redrawn from Yielding, 1997).(1,347 × 565 (92 KB)) - 17:25, 29 September 2021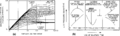
File:Pressure-transient-testing fig2.png (a) Derivative type curve used to match derivatives of test data. (b) Shapes of derivatives of test data for various reservoir conditions.(1,946 × 591 (34 KB)) - 18:23, 14 January 2014
File:M106Ch13Fig02.jpg ...1. B. Firat, 2. B. Kayaköy, 3. B. Kozluca, 4. B. Malatepe, 5. B. Migo, 6. B. Raman, 7. Barbeş, 8. Baysu, 9. Beşikli, 10. Beyçayir, 11. Beykan, 12. B(700 × 491 (61 KB)) - 19:34, 5 July 2016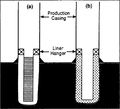
File:Well-completions fig2.png Wellbore diagram of (a) a screen and liner completion and (b) a cement liner completion.(946 × 863 (40 KB)) - 21:20, 14 January 2014
File:Three-dimensional-seismic-method fig2.png {{copyright|a marine 3-D survey and (b) a time-structure map of a marker horizon derived from the 3-D volume of mi (a) Selected time slices. Copyright: a marine 3-D survey and (b) a time-structure map of a marker horizon derived from the 3-D volume of mi(1,338 × 2,684 (369 KB)) - 19:36, 14 January 2014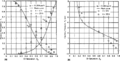
File:Conducting-a-reservoir-simulation-study-an-overview fig2.png (a) Pseudo-relative permeability and (b) capillary pressure curves calculated for two-layer thicknesses compared to(1,939 × 978 (97 KB)) - 18:46, 14 January 2014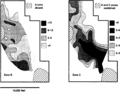
File:Subsurface-maps fig6.png Porosity thickness (ϕH) maps for the B and C zones from the San Andres Formation reservoir, Jordan field, Ector an(1,944 × 1,484 (237 KB)) - 20:42, 14 January 2014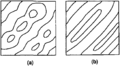
File:Using-and-improving-surface-models-built-by-computer fig5.png ...st algorithms weight data isotropically and creat circular surface forms. (b) Single direction bias forces elliptical weighting, allowing surface form t(923 × 510 (11 KB)) - 22:32, 13 January 2014
File:M31F6.jpg ...ain. From Deltaic environments of deposition, 1981, Coleman, J. M., and D. B. Prior, in AAPG Memoir 31.(1,467 × 1,013 (318 KB)) - 19:40, 15 August 2014
File:Subsurface-maps fig7.png Cumulative oil production map for the A, B, C, and D zones from the San Andres Formation reservoir, Jordan field, Ecto(944 × 1,353 (62 KB)) - 20:42, 14 January 2014
File:M31F3.jpg ...hs). From Deltaic environments of deposition, 1981, Coleman, J. M., and D. B. Prior, in AAPG Memoir 31.(2,941 × 1,884 (830 KB)) - 19:02, 15 August 2014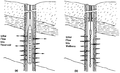
File:Well-completions fig9.png Two perforating methods: (a) Perforating overbalanced with a casing gun and (b) perforating underbalanced with a thrutubing gun.(1,880 × 1,143 (110 KB)) - 21:20, 14 January 2014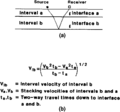
File:Mapping-with-two-dimensional-seismic-data fig4.png ...ay paths, intervals, and interfaces used to help explain the Dix formula. (b) The Dix formula for calculating interval velocities, which assumes that in(907 × 849 (12 KB)) - 19:36, 14 January 2014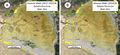
File:Figure3MancosCommRept.jpg ...ed) wells drilled in Mancos pools. A) In the period 2017-2020 (125 wells). B) In 2020 alone (11 wells). Contours show the top Dakota elevation, simplifi(1,615 × 744 (818 KB)) - 20:51, 14 April 2021
File:AlHawajAlQahtaniFigure1.jpg ...folded layer (Sub-Andean Zone, Bolivia), showing a) the deformed state and b) the restored state. c) Distribution of maximum principal stress that resul(979 × 447 (95 KB)) - 20:44, 8 November 2021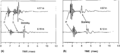
File:Full-waveform-acoustic-logging fig1.png FWAL microseismograms recorded (a) at two source-receiver separations and (b) In a “soft” formation at two source-receiver separations.(1,948 × 865 (19 KB)) - 17:49, 13 January 2014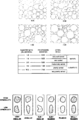
File:Core-description fig2.png ...t for sorting and sorting classes. (Modified from Pettijohn et al. 1987.) (b) Comparison chart for roundness and sphericity. (Modified from Powers, 1953(946 × 1,441 (37 KB)) - 22:38, 13 January 2014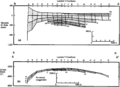
File:Geological-cross-sections fig1.png (a) Stratigraphic and (b) structural cross sections of the Ranger Formation in the Long Beach unit o(1,958 × 1,420 (129 KB)) - 15:32, 14 January 2014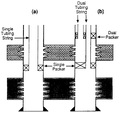
File:Well-completions fig4.png Wellbore diagram of (a) a casing-tubing dual completion and (b) a completion with dual packers and dual tubing strings.(953 × 901 (48 KB)) - 21:20, 14 January 2014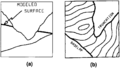
File:Using-and-improving-surface-models-built-by-computer fig12.png ...ed by the higher surface. (a) Cross section showing proper relationships. (b) Map showing surface contours and lines of baselap and truncation.(931 × 530 (11 KB)) - 22:32, 13 January 2014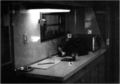
File:Mudlogging-equipment-services-and-personnel fig4.png Sample examination area. (A) Binocular microscope. (B) Ultraviolet box. (C) Radioactivity metering device. (Photo. Copyright: Lon(1,004 × 701 (561 KB)) - 22:31, 14 January 2014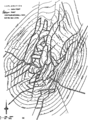
File:Evaluating-structurally-complex-reservoirs fig6.png (a) Structure map and (b) (next page) restored structure map showing fault gaps removed. Remaining g(1,840 × 2,504 (315 KB)) - 18:47, 14 January 2014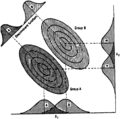
File:Multivariate-data-analysis fig1.png Plot of two-blvariate distributions, showing overlap between groups A and B along both variables <italic>x</italic><sub>1</sub> and <italic>x</italic><(957 × 948 (85 KB)) - 00:51, 14 January 2014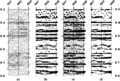
File:Displaying-seismic-data fig1.png Various types of seismic displays: (a) wiggle trace, (b) variable area, (c) variable area wiggle trace, and (d) variable density. C(1,959 × 1,316 (101 KB)) - 01:20, 14 January 2014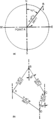
File:Land-description-and-maps fig4.png ...ing the procedure for plotting the metes and bounds property description, (b) The completed plot of the metes and bounds property description.(948 × 2,125 (50 KB)) - 16:15, 14 January 2014
File:M31F16.jpg ...istributary channel in the Mississippi River delta. Coleman, J. M., and D. B. Prior, 1981, Deltaic environments of deposition ''in'' P. A. Scholle and D(356 × 353 (54 KB)) - 18:14, 18 August 2014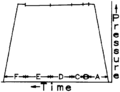
File:Drill-stem-testing fig7.png ...ff gauge below the bottom packer on a straddle test. (A) running in hole; (B) initial flow period; (C) initial buildup; (D) final flow period; (E) final(728 × 559 (6 KB)) - 22:25, 14 January 2014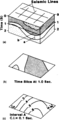
File:Mapping-with-two-dimensional-seismic-data fig6.png (a) Block diagram showing the time that Is mapped for a time slice map. (b) Interval that is mapped on time interval map. (c) Time interval map.(909 × 1,853 (102 KB)) - 19:36, 14 January 2014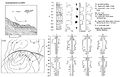
File:M31F26.jpg ...cs of slump deposits in the subaqueous delta plain. Coleman, J. M., and D. B. Prior, 1981, Deltaic environments of deposition ''in'' P. A. Scholle and D(1,499 × 968 (531 KB)) - 18:22, 18 August 2014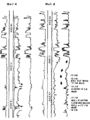
File:Pressure-detection fig3.png ...ric logs of two wells offshore Louisiana. Well A had normal pressure. Well B, 2000 ft away and across a growth fault, showed a sudden decrease in resist(912 × 1,211 (25 KB)) - 18:23, 14 January 2014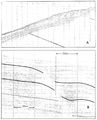
File:M31F25.jpg ...is 10 milliseconds per time line, or 7.6 m (25 ft). Coleman, J. M., and D. B. Prior, 1981, Deltaic environments of deposition ''in'' P. A. Scholle and D(1,087 × 1,348 (940 KB)) - 18:21, 18 August 2014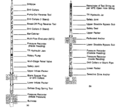
File:Drill-stem-testing fig2.png ...string. (a) Typical MFE inflate open hole string (straddle, off-bottom). (b) Typical MFE straddle string (open hole, conventional, off-bottom). (From F(1,918 × 1,726 (150 KB)) - 22:25, 14 January 2014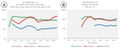
File:Figure5MancosCommRept.jpg ...ew Mexico Oil and Gas Conservation Division whereas the well on the right (B) is designated as an oil well.(1,320 × 556 (175 KB)) - 20:52, 14 April 2021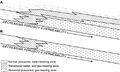
File:BasinCenteredGasFig2.jpg ...ring zones, and abnormally pressured/gas-bearing zones for (A) direct and (B) indirect BCGAs. From Law, Ben E., 2002, Basin-centered gas systems: AAPG B(500 × 298 (46 KB)) - 22:14, 13 January 2015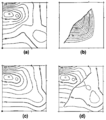
File:Using-and-improving-surface-models-built-by-computer fig16.png (a) Surface model built with no fault constraints. (b) Model of vertical separation. (c) Unfaulted structure model built after re(933 × 1,056 (56 KB)) - 22:32, 13 January 2014
File:M31F13.jpg ...ned distributary deposits in the lower delta plain. Coleman, J. M., and D. B. Prior, 1981, Deltaic environments of deposition in P. A. Scholle and D. Sp(1,508 × 950 (293 KB)) - 15:16, 18 August 2014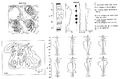
File:M31F9.jpg ...of the bay-fill deposits in the lower delta plain. Coleman, J. M., and D. B. Prior, 1981, Deltaic environments of deposition in P. A. Scholle and D. Sp(1,510 × 990 (305 KB)) - 15:13, 18 August 2014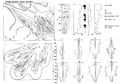
File:M31F22.jpg ...tidal ridge deposits in the subaqueous delta plain. Coleman, J. M., and D. B. Prior, 1981, Deltaic environments of deposition ''in'' P. A. Scholle and D(1,416 × 989 (554 KB)) - 18:20, 18 August 2014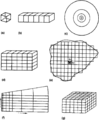
File:Conducting-a-reservoir-simulation-study-an-overview fig1.png Typical models used in reservoir simulation. (a) Zero-dimensional tank. (b) One-dimensional linear. (c) One-dimensional radial. (d) Two-dimensional cr(922 × 1,118 (50 KB)) - 18:46, 14 January 2014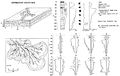
File:M31F17.jpg ...y-mouth bar deposits in the subaqueous delta plain. Coleman, J. M., and D. B. Prior, 1981, Deltaic environments of deposition ''in'' P. A. Scholle and D(1,519 × 957 (150 KB)) - 18:17, 18 August 2014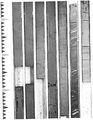
File:M31F29.jpg ...ental shelf off the modern Mississippi River delta. Coleman, J. M., and D. B. Prior, 1981, Deltaic environments of deposition ''in'' P. A. Scholle and D(1,161 × 1,502 (970 KB)) - 18:25, 18 August 2014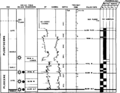
File:Paleontology fig1.png ...flex = ''Globorotalia flexuosa'', Trim A = ''Trimosina denticulata'', Hyal B = ''Hyalinea balthica'', Glob M = ''Globorotalia miocenica'', Glob alt = ''(1,953 × 1,521 (104 KB)) - 17:48, 14 January 2014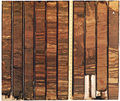
File:M31F15.jpg ...ppi River delta. Diameter of cores is 8 cm (3 in.). Coleman, J. M., and D. B. Prior, 1981, Deltaic environments of deposition in P. A. Scholle and D. Sp(1,194 × 1,001 (1.91 MB)) - 15:17, 18 August 2014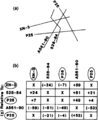
File:Mapping-with-two-dimensional-seismic-data fig3.png ...ity function of 8300 ft/sec were used, errors of +6 ft at A and -440 ft at B would appear on the depth map.(885 × 1,087 (41 KB)) - 19:36, 14 January 2014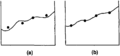
File:Using-and-improving-surface-models-built-by-computer fig4.png ...ons through the same data. (a) The surface model does not honor the data. (b) Surface is shifted to data by modeling the error between the data and the(934 × 437 (5 KB)) - 22:32, 13 January 2014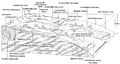
File:M31F23.jpg ...contemporary faults in the Mississippi River delta. Coleman, J. M., and D. B. Prior, 1981, Deltaic environments of deposition ''in'' P. A. Scholle and D(1,476 × 791 (905 KB)) - 18:20, 18 August 2014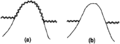
File:Using-and-improving-surface-models-built-by-computer fig9.png ...ith the lower surface in areas of baselap (for cross section display) and (b) as missing in areas of baselap (for map display).(872 × 317 (5 KB)) - 22:32, 13 January 2014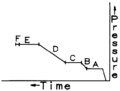
File:Drill-stem-testing fig3.png ...e located inside and above the closing tool. (A) Add cushion/run in hole; (B) initial flow period; (C) initial shut-in period; (D) final flow period; (E(748 × 570 (5 KB)) - 22:25, 14 January 2014
File:Mudlogging-equipment-services-and-personnel fig1.png Standard mudiogger's work area. (A) Chromatograph. (B) Chromatograph chart. (C) Back-up chromatograph. (D) Depth and time monitor(1,013 × 1,483 (1.1 MB)) - 22:31, 14 January 2014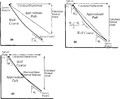
File:Conversion-of-well-log-data-to-subsurface-stratigraphic-and-structural-information fig4.png ...rse by the (a) tangential method (Craig and Randall, 1976; Dailey, 1977), (b) angle averaging method (Craig and Randall, 1976), and (c) balanced tangent(1,937 × 1,603 (60 KB)) - 16:38, 14 January 2014
File:Mudlogging-equipment-services-and-personnel fig3.png General layout of mudlogging unit. (A) Sample examination area. (B) Mudlogger's work area. (C) Sample preparation area. (Photo. Copyright: Lon(1,008 × 710 (614 KB)) - 22:31, 14 January 2014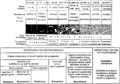
File:Thin-section-analysis fig2.png Carbonate classification schemes of (a) Folk (1959) and (b) Dunham (1962), both based on textures observed in hand specimen or thin se(1,959 × 1,366 (182 KB)) - 21:07, 14 January 2014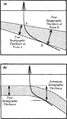
File:Conversion-of-well-log-data-to-subsurface-stratigraphic-and-structural-information fig7.png ...thickness is large in relation to the downdip deviation of the well path. (b) Change in dip produces an error in estimation of the true stratigraphic th(950 × 1,693 (94 KB)) - 16:38, 14 January 2014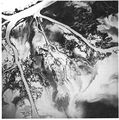
File:M31F8.jpg ...e lower delta plain of the Mississippi River delta. Coleman, J. M., and D. B. Prior, 1981, Deltaic environments of deposition in P. A. Scholle and D. Sp(744 × 752 (412 KB)) - 15:12, 18 August 2014
File:Seismic-migration fig5.png (a) CMP stack showing reffections from a salt dome in the Gulf of Mexico. (b) Stack after DMO processing. Steep portions of diffractions and reflections(1,021 × 2,454 (1.71 MB)) - 19:34, 14 January 2014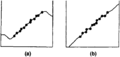
File:Using-and-improving-surface-models-built-by-computer fig3.png ...average algorithm tend to “come back” to the average of near data values. (b) Acceptable surface extrapolation achieved by creating a first-order trend,(924 × 438 (5 KB)) - 22:32, 13 January 2014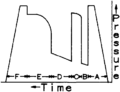
File:Drill-stem-testing fig6.png ...ges. (A) Run in hole, gauge measuring hydrostatic pressure of mud column; (B) initial flow period; (C) initial buildup; (D) final flow period; (E) final(724 × 556 (6 KB)) - 22:25, 14 January 2014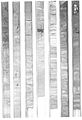
File:M31F11.jpg ...f the bay infill. Diameter of core is 8 cm (3 in.). Coleman, J. M., and D. B. Prior, 1981, Deltaic environments of deposition in P. A. Scholle and D. Sp(951 × 1,393 (675 KB)) - 15:15, 18 August 2014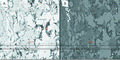
File:M102Ch1Fg4.jpg SE2 (a) and BSE1 (b) image of a cross section of a shale rock. Note that the contrast between c(1,492 × 746 (1.74 MB)) - 21:56, 14 August 2014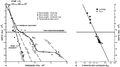
File:BasinCenteredGasFig7.jpg (A) Pressure and temperature and (B) vitrinite reflectance gradients for the Belco 3ñ28 Merna well, northern G(700 × 392 (40 KB)) - 18:58, 14 January 2015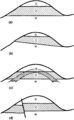
File:Fluid-contacts fig2.png ...tacts indicative of hydrostatic conditions in homogeneous reservoir rock. (b) Tilted, flat contacts resulting from hydrodynamic conditions. (c) Contact(944 × 1,536 (55 KB)) - 01:51, 14 January 2014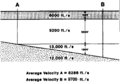
File:Mapping-with-two-dimensional-seismic-data fig2.png (a) Crude base map illustrating seismic line intersections. (b) Table showing misties at seismic line intersections (times in milliseconds(939 × 644 (47 KB)) - 19:36, 14 January 2014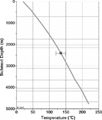
File:H4CH12FG5.JPG ...2012, Hicks, P. J. Jr., C. M. Fraticelli, J. D. Shosa, M. J. Hardy, and M. B. Townsley, ''in'' Peters, Kenneth E., David J. Curry, and Marek Kacewicz, e(600 × 707 (97 KB)) - 20:26, 9 July 2015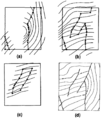
File:Using-and-improving-surface-models-built-by-computer fig13.png Separate surface models are built for each fault block. (a, b, and c) The surface for each fault block is allowed to extend past faults d(926 × 1,096 (55 KB)) - 22:32, 13 January 2014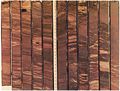
File:M31F19.jpg ...tal bar deposit. Diameter of cores is 8 cm (3 in.). Coleman, J. M., and D. B. Prior, 1981, Deltaic environments of deposition ''in'' P. A. Scholle and D(1,343 × 1,017 (615 KB)) - 18:17, 18 August 2014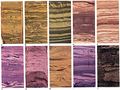
File:M31F10v2.jpg ...e marsh environments and cap the bay fill sequence. Coleman, J. M., and D. B. Prior, 1981, Deltaic environments of deposition in P. A. Scholle and D. Sp(1,334 × 1,000 (178 KB)) - 15:14, 18 August 2014
File:M114CH03FG05.jpg ...aphic maps of the (A) main carrier horizon, lowermost Fatehgarh Formation (B) main source rock unit, the Sarovar Member of the Barmer Hill Formation, an(700 × 307 (64 KB)) - 17:50, 4 January 2019
File:Quick-look-lithology-from-logs fig1.png ...te that this is the shallowest interval, so the shale is least compacted. (b) Cylinder shape, blocky. Note that the SP log is featureless because the bo(945 × 1,311 (140 KB)) - 16:37, 14 January 2014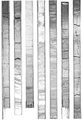
File:M31F12.jpg ...ay-fill sequence. Diameter of core is 8 cm (3 in.). Coleman, J. M., and D. B. Prior, 1981, Deltaic environments of deposition in P. A. Scholle and D. Sp(946 × 1,383 (664 KB)) - 15:15, 18 August 2014
File:BasinCenteredGasFig8.jpg (A) Pressure and temperature and (B) vitrinite reflectance gradients in the El Paso Natural Gas 1 Wagon Wheel w(700 × 389 (41 KB)) - 19:13, 14 January 2015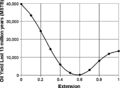
File:H4CH12FG10.JPG ...2012, Hicks, P. J. Jr., C. M. Fraticelli, J. D. Shosa, M. J. Hardy, and M. B. Townsley, ''in'' Peters, Kenneth E., David J. Curry, and Marek Kacewicz, e(600 × 439 (52 KB)) - 21:21, 13 July 2015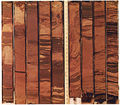
File:M31F20.jpg ...uth bar deposit. Diameter of cores is 8 cm (3 in.). Coleman, J. M., and D. B. Prior, 1981, Deltaic environments of deposition ''in'' P. A. Scholle and D(1,158 × 1,014 (1.94 MB)) - 18:18, 18 August 2014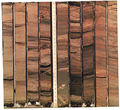
File:M31F21.jpg ...th bar deposits. Diameter of cores is 8 cm (3 in.). Coleman, J. M., and D. B. Prior, 1981, Deltaic environments of deposition ''in'' P. A. Scholle and D(1,120 × 1,026 (1.69 MB)) - 18:19, 18 August 2014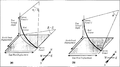
File:Conversion-of-well-log-data-to-subsurface-stratigraphic-and-structural-information fig5.png ...ature (constant increase or decrease in deviation between survey points). (b) Minimum curvature method showing chord of single circle and the angle ϕ,(1,968 × 1,106 (119 KB)) - 16:38, 14 January 2014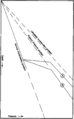
File:Pressure-detection fig2.png ...the weight of the overburden, which it then parallels. In the case of line B, the increase of pressure above normal follows the aquathermal gradient (co(942 × 1,519 (43 KB)) - 18:23, 14 January 2014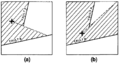
File:Using-and-improving-surface-models-built-by-computer fig15.png ...ted by +) to the west of fault A can only see data in the hatchured area. (b) A grid node farther to the south of fault A can see more data, thus the su(926 × 491 (27 KB)) - 22:32, 13 January 2014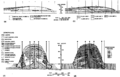
File:Flow-units-for-reservoir-characterization fig2.png ...nit subdivisions of clastic and carbonate reservoirs. (a) Lithofacies and (b) flow unit subdivision of the Shannon Sandstone body in the Hartzog Draw fi(2,737 × 1,751 (237 KB)) - 23:14, 14 January 2014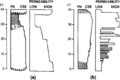
File:Geological-heterogeneities fig2.png ...ification and permeability profiles of (a) fining- or thinning-upward and (b) coarsening- or thickening-upward sequences. ''Fining'' and ''coarsening''(940 × 630 (40 KB)) - 15:35, 14 January 2014
File:M102Ch1Fg6.jpg ...-hued quartz grains indicate higher grade metamorphism (phyllite-schist). (b) Detail of a large quartz grain in center of image (arrow) displays multipl(502 × 518 (978 KB)) - 22:08, 14 August 2014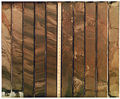
File:M31F28.jpg ...by marine clays. Diameter of cores is 8 cm (3 in.). Coleman, J. M., and D. B. Prior, 1981, Deltaic environments of deposition ''in'' P. A. Scholle and D(1,230 × 1,012 (1.84 MB)) - 18:24, 18 August 2014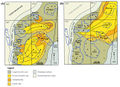
File:M115CH10FG05.jpg ...d schematic map showing the depositional extent of the (A) South Brae and (B) North Brae submarine fan lobes within the Brae depositional system. Note t(1,281 × 934 (1.29 MB)) - 18:44, 17 January 2019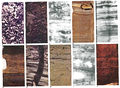
File:M31F7.jpg ...ent. From Deltaic environments of deposition, 1981, Coleman, J. M., and D. B. Prior, in AAPG Memoir 31.(1,366 × 1,004 (1.31 MB)) - 19:50, 15 August 2014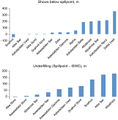
File:M114CH10FG02.jpg ...between the structural spillpoint and the hydrocarbon–water contact) and (B) shows to or deeper than the structural spillpoint (presented as the vertic(641 × 652 (54 KB)) - 23:02, 8 January 2019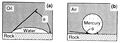
File:Charles-l-vavra-john-g-kaldi-robert-m-sneider capillary-pressure 1.jpg ...esive forces, the fluid spreads out on the surface and is termed wetting. (b) If cohesive forces exceed adhesive forces, the liquid beads up and is term(1,200 × 434 (272 KB)) - 17:41, 13 September 2013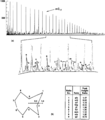
File:Oil-and-condensate-analysis fig5.png ...graphic data can be displayed as chromatograms at different attenuations, (b) as star diagrams of selected peak height ratios, or (c) as data tables of(1,942 × 2,226 (120 KB)) - 17:17, 14 January 2014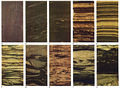
File:M31F18.jpg ...plays that cap the distributary-mouth bar deposits. Coleman, J. M., and D. B. Prior, 1981, Deltaic environments of deposition ''in'' P. A. Scholle and D(1,349 × 994 (1.86 MB)) - 18:16, 18 August 2014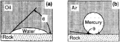
File:Capillary-pressure fig1.png ...e forces, the fluid spreads out on the surface and is termed ''wetting''. (b) If cohesive forces exceed adhesive forces, the liquid beads up and is term(941 × 333 (26 KB)) - 18:22, 14 January 2014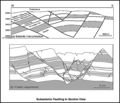
File:M91Ch13FG92.JPG ...seismic interpretation from the Gullfaks field, Norwegian North Sea, and (b) a plaster model deformed by plane strain extension. The plaster model show(600 × 517 (60 KB)) - 21:40, 29 April 2015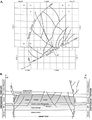
File:BasinCenteredGasFig4.jpg ...g major faults and location of cross section AA' through the Jonah field. (B) Shaded areas along cross section AA' represent overpressured, gas-saturate(600 × 783 (79 KB)) - 22:22, 13 January 2015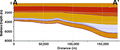
File:H4CH12FG3.JPG ...2012, Hicks, P. J. Jr., C. M. Fraticelli, J. D. Shosa, M. J. Hardy, and M. B. Townsley, ''in'' Peters, Kenneth E., David J. Curry, and Marek Kacewicz, e(600 × 252 (67 KB)) - 20:14, 9 July 2015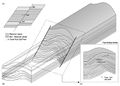
File:GumelarFigure4.jpg ...seal by juxtaposing impermeable units against potential reservoir units. (B) In three dimensions, the interactions of juxtaposed units on the fault sur(652 × 468 (90 KB)) - 21:13, 28 September 2021
File:H4CH12FG12.JPG ...2012, Hicks, P. J. Jr., C. M. Fraticelli, J. D. Shosa, M. J. Hardy, and M. B. Townsley, in Peters, Kenneth E., David J. Curry, and Marek Kacewicz, eds.,(600 × 346 (51 KB)) - 21:41, 13 July 2015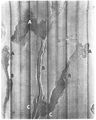
File:M31F24.jpg ...ely 10-m water depth) to bottom (water depth 60 m). Coleman, J. M., and D. B. Prior, 1981, Deltaic environments of deposition ''in'' P. A. Scholle and D(758 × 947 (524 KB)) - 18:21, 18 August 2014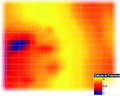
File:H4CH12FG13.JPG ...2012, Hicks, P. J. Jr., C. M. Fraticelli, J. D. Shosa, M. J. Hardy, and M. B. Townsley, in Peters, Kenneth E., David J. Curry, and Marek Kacewicz, eds.,(600 × 480 (128 KB)) - 21:42, 13 July 2015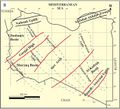
File:M106Ch04Fig2B.jpg ...ures that formed during late Precambrian to Late Carboniferous tectonism. (B) Hercynian structural trends caused by the Late Carboniferous collision bet(700 × 635 (73 KB)) - 19:43, 28 March 2016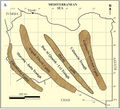
File:M106Ch04Fig2A.jpg ...ures that formed during late Precambrian to Late Carboniferous tectonism. (B) Hercynian structural trends caused by the Late Carboniferous collision bet(700 × 633 (66 KB)) - 19:44, 28 March 2016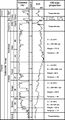
File:Mth14ch07f02.jpg ...oost Primary and EOR Production, Prudhoe Bay Field, Alaska , by R. S. Tye, B. A. Watson, P. L. McGuire, and M. M. Maguire, Pages 113 - 125, in AAPG Meth(500 × 923 (106 KB)) - 17:50, 7 December 2015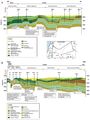
File:M106Ch07Fig06.jpg ...pression, Basakt Plateau, and Risha Limestone Plateau to the Iraqi border. b) Schematic north-south structural cross section from the Damascus Basin thr(700 × 932 (98 KB)) - 21:10, 18 April 2016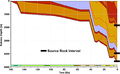
File:H4CH12FG4.JPG ...2012, Hicks, P. J. Jr., C. M. Fraticelli, J. D. Shosa, M. J. Hardy, and M. B. Townsley, ''in'' Peters, Kenneth E., David J. Curry, and Marek Kacewicz, e(600 × 369 (82 KB)) - 20:20, 9 July 2015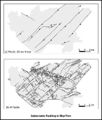
File:M91Ch13FG93.JPG ...faults that are detectable by seismic surveys at reservoir depths. In map (b), every mapped fault is shown, with fault throws of between 10 cm (4 in.) a(600 × 704 (72 KB)) - 21:40, 29 April 2015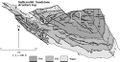
File:Mth14ch07f04.jpg ...oost Primary and EOR Production, Prudhoe Bay Field, Alaska , by R. S. Tye, B. A. Watson, P. L. McGuire, and M. M. Maguire, Pages 113 - 125, in AAPG Meth(500 × 258 (39 KB)) - 17:58, 7 December 2015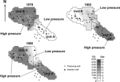
File:Mth14ch02f06.jpg ...essure of the Yowlumne Sandstone. The variations indicate that Units A and B may represent separate compartments that are not in fluid communication wit(700 × 481 (51 KB)) - 17:48, 4 December 2015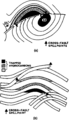
File:Evaluating-structurally-complex-reservoirs fig7.png .... Positions of cross fault spill points and synclinal spill points shown. (b) Fault plane section illustrating the synclinal and cross fault spill point(861 × 1,502 (31 KB)) - 18:47, 14 January 2014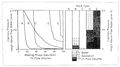
File:Charles-l-vavra-john-g-kaldi-robert-m-sneider capillary-pressure 5.jpg ...rtical saturation profile. Note also the wide transition zone in rock type B caused by poor sorting of the pore throats.(1,200 × 670 (154 KB)) - 17:42, 13 September 2013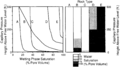
File:Capillary-pressure fig5.png ...rtical saturation profile. Note also the wide transition zone in rock type B caused by poor sorting of the pore throats.(1,805 × 1,011 (101 KB)) - 18:22, 14 January 2014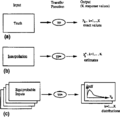
File:Monte-carlo-and-stochastic-simulation-methods fig1.png ...fer function are perfectly known, resulting in the exact response values. (b) Traditional approach—The input values are interpolated from sparse data(923 × 900 (12 KB)) - 20:28, 14 January 2014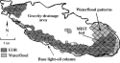
File:Mth14ch07f05.jpg ...oost Primary and EOR Production, Prudhoe Bay Field, Alaska , by R. S. Tye, B. A. Watson, P. L. McGuire, and M. M. Maguire, Pages 113 - 125, in AAPG Meth(500 × 264 (41 KB)) - 18:09, 7 December 2015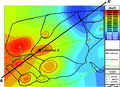
File:H4CH12FG2.JPG ...2012, Hicks, P. J. Jr., C. M. Fraticelli, J. D. Shosa, M. J. Hardy, and M. B. Townsley, ''in'' Peters, Kenneth E., David J. Curry, and Marek Kacewicz, e(800 × 581 (246 KB)) - 20:11, 9 July 2015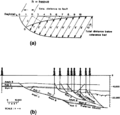
File:Evaluating-structurally-complex-reservoirs fig4.png ...erpolation between these points is carried out using a half grid spacing. (b) Fault trajectory reconstruction by the Groshong (1989b) method uses simult(951 × 915 (46 KB)) - 18:47, 14 January 2014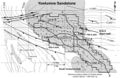
File:Mth14ch02f01.jpg ...ape of the Yowlumne Sandstone and the relationship of Yowlumne Units A and B to the anticlinal closure. From M. S. Clark, R. K. Prather, J. D. Melvin, 2(700 × 457 (103 KB)) - 23:18, 3 December 2015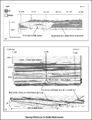
File:M91FG190.JPG ...with permission from, and © by, the Society of Petroleum Engineers. (b) Horizontal well drilled to target oil within a mouth bar in the Ivishak Fo(800 × 1,047 (162 KB)) - 18:05, 20 August 2015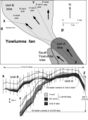
File:Mth14ch02f05.jpg ...f structural relief between oil-water contacts in the lobes of Units A and B. From M. S. Clark, R. K. Prather, J. D. Melvin, 2003, Characterization and(500 × 682 (64 KB)) - 17:07, 4 December 2015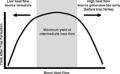
File:H4CH12FG8.JPG ...2012, Hicks, P. J. Jr., C. M. Fraticelli, J. D. Shosa, M. J. Hardy, and M. B. Townsley, ''in'' Peters, Kenneth E., David J. Curry, and Marek Kacewicz, e(600 × 372 (49 KB)) - 20:32, 13 July 2015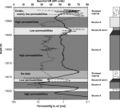
File:Mth14ch02f09.jpg ...well revealing greater permeabilities in Bouma A layers relative to Bouma B and C layers, and slumped intervals. These variations result in the creatio(600 × 541 (60 KB)) - 20:21, 4 December 2015
File:H4CH12FG1.JPG ...2012, Hicks, P. J. Jr., C. M. Fraticelli, J. D. Shosa, M. J. Hardy, and M. B. Townsley, in Peters, Kenneth E., David J. Curry, and Marek Kacewicz, eds.,(600 × 378 (60 KB)) - 19:59, 9 July 2015
File:Mth14ch07f03.jpg ...oost Primary and EOR Production, Prudhoe Bay Field, Alaska , by R. S. Tye, B. A. Watson, P. L. McGuire, and M. M. Maguire, Pages 113 - 125, in AAPG Meth(700 × 409 (77 KB)) - 17:55, 7 December 2015
File:H4CH12FG7.JPG ...2012, Hicks, P. J. Jr., C. M. Fraticelli, J. D. Shosa, M. J. Hardy, and M. B. Townsley, ''in'' Peters, Kenneth E., David J. Curry, and Marek Kacewicz, e(600 × 599 (51 KB)) - 21:12, 9 July 2015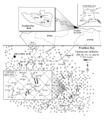
File:Mth14ch07f01.jpg ...oost Primary and EOR Production, Prudhoe Bay Field, Alaska , by R. S. Tye, B. A. Watson, P. L. McGuire, and M. M. Maguire, Pages 113 - 125, ''in'' AAPG(700 × 809 (135 KB)) - 17:34, 7 December 2015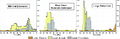
File:H4CH12FG9.JPG ...2012, Hicks, P. J. Jr., C. M. Fraticelli, J. D. Shosa, M. J. Hardy, and M. B. Townsley, ''in'' Peters, Kenneth E., David J. Curry, and Marek Kacewicz, e(800 × 262 (80 KB)) - 20:34, 13 July 2015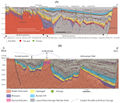
File:M114CH03FG03.jpg ...t north across which there has been strong inversion. (B) West–east line B–B’ showing asymmetric half graben structure and the steep-sided nature of t(700 × 600 (112 KB)) - 17:49, 4 January 2019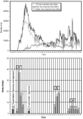
File:Mth14ch04f02.jpg ...oduction decreased from peak rates in 1971 to a low of 2000 BOPD in 1994. (b) Well activity by year in the South Pass 62 field. Dark gray bars indicate(500 × 718 (88 KB)) - 16:08, 7 December 2015
File:M98Ch3Fig3.JPG ...na (1993); 3, Webster (2003, 2005, 2007); 4, Sundberg and McCollum (2003a, b); 5, McCollum and Sundberg (2007); 6, Sundberg (1994, 2005); 7, Robison (19(600 × 743 (211 KB)) - 16:39, 19 August 2014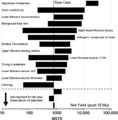
File:H4CH12FG6.JPG ...2012, Hicks, P. J. Jr., C. M. Fraticelli, J. D. Shosa, M. J. Hardy, and M. B. Townsley, ''in'' Peters, Kenneth E., David J. Curry, and Marek Kacewicz, e(600 × 611 (85 KB)) - 21:07, 9 July 2015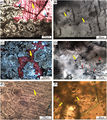
File:BLTN12220fig5.jpg ...rmation of fracture and oil charging, well LJ1, 3470.40 m (11,382.91 ft). (B) Two-phase aqueous fluid inclusions (yellow arrows) present in pre-TSR calc(444 × 500 (324 KB)) - 13:22, 13 August 2014


