Search results
Jump to navigation
Jump to search
File:Log-analysis-applications fig5.png ...stant × formation water resistivity) and relates water saturation (<italic>S</italic><sub>w</sub>) to porosity and true resistivity.(929 × 801 (40 KB)) - 16:36, 14 January 2014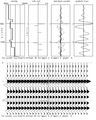
File:Interpreting-seismic-data fig12-7.png From software by S. Hill, Conoco.(1,430 × 1,789 (478 KB)) - 19:53, 17 January 2014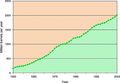
File:St54Ch3Figure21.jpg Volumes of the world's total natural-gas liquids production.(600 × 414 (65 KB)) - 21:54, 20 May 2014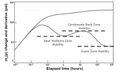
File:AlAhmadiTawfiqFigure6.jpg ...ndensate Well Producing Below the Dew Point (Halim, A., Nuri, F., & Adi P, S. 2015).(737 × 474 (37 KB)) - 23:06, 9 November 2021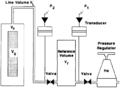
File:Porosity fig6.png Schematic diagram of Boyle's law helium porosimeter for grain volume measurement.(917 × 676 (30 KB)) - 18:19, 14 January 2014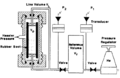
File:Porosity fig5.png Schematic diagram of a Boyle's law helium poroslmeter for pore volume measurement.(932 × 606 (36 KB)) - 18:19, 14 January 2014
File:Updated lwandle4.jpg {{PD-self}}{{Information | description = Lwandle plate and it's neighboring plates | source = Adobe Illustrator | date = 5 November 2014 |(537 × 746 (105 KB)) - 17:22, 20 November 2014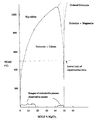
File:CN24FG2.jpg ...tions in the system CaCO<sub>3</sub> - MgCO<sub>3</sub>. From Land, Lyndon S., 1982, Dolomitization: AAPG Course Notes 24, p. 1-20.(626 × 781 (50 KB)) - 20:24, 15 July 2015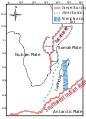
File:Updated lwandle3.svg {{PD-self}}{{Information | description = Lwandle plate and it's neighboring plates | source = Adobe Illustrator | date = 5 November 2014 |(537 × 746 (281 KB)) - 16:16, 20 November 2014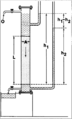
File:Permeability fig1.png Modified schematic diagram of Darcy's experimental apparatus. (Modified from Hubbert, 1953.)(951 × 1,571 (48 KB)) - 18:02, 14 January 2014
File:Stamps2008animated.pdf {{PD-self}}{{Information | description = Lwandle plate and it's relative velocities at the boundaries | source = Adobe Illustrator | date =(444 KB) - 16:19, 20 November 2014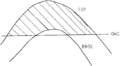
File:Using-and-improving-surface-models-built-by-computer fig21.png ...by grids representing the top and base of reservoir and the fluid contact(s).(881 × 484 (19 KB)) - 22:33, 13 January 2014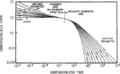
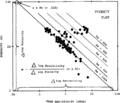
File:Pressure-transient-testing fig6.png Fetkovich's type curve for analyzing long-term production data. (After Fetkovich, 1980.(945 × 580 (43 KB)) - 18:23, 14 January 2014
File:Stamps2008animatedX.jpg {{PD-self}}{{Information | description = Lwandle plate and it's relative velocities at plate boundaries | source = Adobe Illustrator | date(323 × 576 (66 KB)) - 17:27, 20 November 2014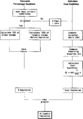
File:About-taxes fig2.png ...hat remaining reserves (U) are end of year. In cost depletion calculation, S = sales during year. (After Thompson and Wright, 1985.)(922 × 1,325 (16 KB)) - 20:53, 14 January 2014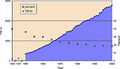
File:St54Figure46.JPG World hydroelectric power generation and percent of the world's total electricity generation. Figure 46 from Salvador, Amos, Energy-A Histo(600 × 344 (59 KB)) - 17:27, 30 June 2014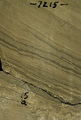
File:FG18CoreSt63Appendix3.JPG Core slab photo. From Ruppel, Stephen C., 2012, Appendix 3, in S. C. Ruppel, ed., Anatomy of a giant carbonate reservoir: Fullerton Clear Fo(600 × 890 (315 KB)) - 16:10, 29 June 2015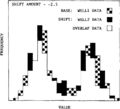
File:Log-analysis-applications fig7.png ...re data interactively from one well to another by shifting the second well's data across the base well on the screen. A visual best fit is usually satis(925 × 838 (28 KB)) - 16:36, 14 January 2014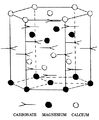
File:CN24FG1.jpg ...es, and the alternation of calcium and magnesium planes. From Land, Lyndon S., 1982, Dolomitization: AAPG Course Notes 24, p. 1-20.(590 × 715 (71 KB)) - 20:14, 15 July 2015
File:MainPageFG18CoreSt63Appendix3.jpg Core slab photo. From Ruppel, Stephen C., 2012, Appendix 3, in S. C. Ruppel, ed., Anatomy of a giant carbonate reservoir: Fullerton Clear Fo(400 × 400 (104 KB)) - 16:14, 29 June 2015
File:CN24FG3.jpg ...l stoichiometric dolomite. Photograph by Richard Reeder. From Land, Lyndon S., 1982, Dolomitization: AAPG Course Notes 24, p. 1-20.(496 × 611 (128 KB)) - 20:47, 15 July 2015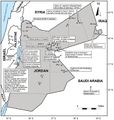
File:M106Ch07Fig07.jpg ...ordanian petroleum wells. After NRA (2001). 100 km (62.1 mi). From Luning, S., and J. Kuss, 2014, Petroleum geology of Jordan, in L. Marlow, C. Kendall,(700 × 735 (86 KB)) - 21:41, 18 April 2016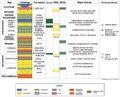
File:M106Ch07Fig02.jpg ...ctonic events, and hydrocarbon occurrences. After NRA (2001). From Luning, S., and J. Kuss, 2014, Petroleum geology of Jordan, in L. Marlow, C. Kendall,(700 × 566 (80 KB)) - 20:34, 18 April 2016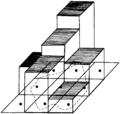
File:Using-and-improving-surface-models-built-by-computer fig18.png ...d on the grid node and lies either inside or outside the polygon. The cell's area is multiplied by its z value (thickness) and that volume is added to v(835 × 790 (37 KB)) - 22:32, 13 January 2014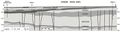
File:M106Ch07Fig03.jpg ...ogressively older toward the west. From Lüning et al. (2006). From Luning, S., and J. Kuss, 2014, Petroleum geology of Jordan, in L. Marlow, C. Kendall,(700 × 186 (24 KB)) - 20:47, 18 April 2016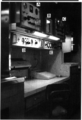
File:Mudlogging-equipment-services-and-personnel fig1.png Standard mudiogger's work area. (A) Chromatograph. (B) Chromatograph chart. (C) Back-up chromato(1,013 × 1,483 (1.1 MB)) - 22:31, 14 January 2014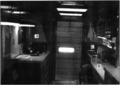
File:Mudlogging-equipment-services-and-personnel fig3.png General layout of mudlogging unit. (A) Sample examination area. (B) Mudlogger's work area. (C) Sample preparation area. (Photo. Copyright: Long Co. Technic(1,008 × 710 (614 KB)) - 22:31, 14 January 2014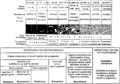
File:Thin-section-analysis fig2.png ...both based on textures observed in hand specimen or thin section. In Folk's scheme, the black pattern represents lime mud matrix, the lined pattern rep(1,959 × 1,366 (182 KB)) - 21:07, 14 January 2014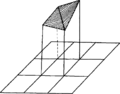
File:Using-and-improving-surface-models-built-by-computer fig19.png The cell's corners are defined by grid nodes. The top is defined by two or more planes(817 × 641 (22 KB)) - 22:32, 13 January 2014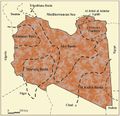
File:M106Ch04Fig03.jpg ...(productive basins, future prospective) 200 km (124.3 mi). From Hassan, H. S., and C. C. G. Kendall, 2014, Hydrocarbon provinces of Libya: A petroleum s(700 × 676 (77 KB)) - 20:13, 28 March 2016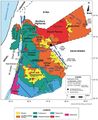
File:M106Ch07Fig1.jpg ...after Beydoun et al. (1994) and NRA (2001). 100 km (62.1 mi). From Luning, S., and J. Kuss, 2014, Petroleum geology of Jordan, in L. Marlow, C. Kendall,(700 × 857 (97 KB)) - 20:28, 18 April 2016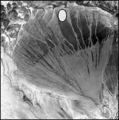
File:M91Ch11FG69.JPG An alluvial fan in China's Xinjuang Province. The diameter of the fan is about 170 km (106 mi). Courte(600 × 606 (106 KB)) - 15:42, 27 April 2015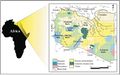
File:M106h04Fig01.jpg ...ter Rusk, 2001; Ramos et al., 2006) 500 km (310.7 mi). From Hassan, Hassan S. and Christopher C. G. Kendall, Hydrocarbon provinces of Libya: A petroleum(700 × 439 (50 KB)) - 19:01, 28 March 2016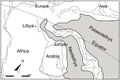
File:M106Ch07Fig05.jpg ...nd Borel (2002). 1500 km (932 mi). From Lüning et al. (2006). From Luning, S., and J. Kuss, 2014, Petroleum geology of Jordan, in L. Marlow, C. Kendall,(700 × 468 (49 KB)) - 21:06, 18 April 2016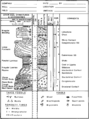
File:Core-description fig1.png ...sils, and contacts are given. Grain size of sillclclastic rocks and Dunham's (1962) classification of limestones are indicated in the column on the left(1,879 × 2,521 (232 KB)) - 22:38, 13 January 2014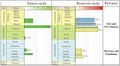
File:M106Ch04Fig04.jpg ...Burwood et al., 2003; Energy Intelligence Research, 2004). From Hassan, H. S., and C. C. G. Kendall, 2014, Hydrocarbon provinces of Libya: A petroleum s(700 × 383 (50 KB)) - 20:18, 28 March 2016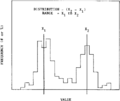
File:Log-analysis-applications fig3.png A histogram display of a traces value range. Frequency nodes in a trace's data values (<italic>x</italic><sub>1</sub>, and <italic>x</italic><sub>2</(937 × 789 (19 KB)) - 16:36, 14 January 2014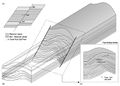
File:GumelarFigure4.jpg ...actions of juxtaposed units on the fault surface can be complex. (c) Allan's Mapping technique resolves the fault surface into a flat plane and maps the(652 × 468 (90 KB)) - 21:13, 28 September 2021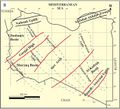
File:M106Ch04Fig2B.jpg ...6), Anketell (1996), and Hallett (2002) 500 km (310.7 mi). From Hassan, H. S., and C. C. G. Kendall, 2014, Hydrocarbon provinces of Libya: A petroleum s(700 × 635 (73 KB)) - 19:43, 28 March 2016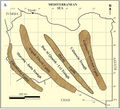
File:M106Ch04Fig2A.jpg ...6), Anketell (1996), and Hallett (2002) 500 km (310.7 mi). From Hassan, H. S., and C. C. G. Kendall, 2014, Hydrocarbon provinces of Libya: A petroleum s(700 × 633 (66 KB)) - 19:44, 28 March 2016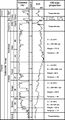
File:Mth14ch07f02.jpg ...esigns Boost Primary and EOR Production, Prudhoe Bay Field, Alaska , by R. S. Tye, B. A. Watson, P. L. McGuire, and M. M. Maguire, Pages 113 - 125, in A(500 × 923 (106 KB)) - 17:50, 7 December 2015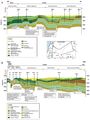
File:M106Ch07Fig06.jpg ...Azraq Depression to the Sirhan Depression. After NRA (2001). From Luning, S., and J. Kuss, 2014, Petroleum geology of Jordan, in L. Marlow, C. Kendall,(700 × 932 (98 KB)) - 21:10, 18 April 2016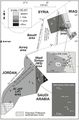
File:M106Ch07Fig04.jpg ...ning et al. (2006). 5 km (3.1 mi). From Lüning et al. (2006). From Luning, S., and J. Kuss, 2014, Petroleum geology of Jordan, in L. Marlow, C. Kendall,(564 × 855 (75 KB)) - 20:49, 18 April 2016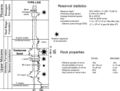
File:Mth14ch02f03.jpg ...decreases from the axis of the fan eastward toward the fan margin. From M. S. Clark, R. K. Prather, J. D. Melvin, 2003, Characterization and Exploitatio(700 × 529 (75 KB)) - 15:26, 4 December 2015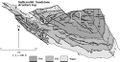
File:Mth14ch07f04.jpg ...esigns Boost Primary and EOR Production, Prudhoe Bay Field, Alaska , by R. S. Tye, B. A. Watson, P. L. McGuire, and M. M. Maguire, Pages 113 - 125, in A(500 × 258 (39 KB)) - 17:58, 7 December 2015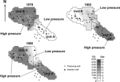
File:Mth14ch02f06.jpg ...compartments that are not in fluid communication with one another. From M. S. Clark, R. K. Prather, J. D. Melvin, 2003, Characterization and Exploitatio(700 × 481 (51 KB)) - 17:48, 4 December 2015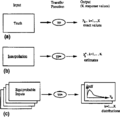
File:Monte-carlo-and-stochastic-simulation-methods fig1.png ...rocessing, provide a probability distribution (pdf) for the response value(s).(923 × 900 (12 KB)) - 20:28, 14 January 2014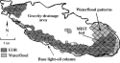
File:Mth14ch07f05.jpg ...esigns Boost Primary and EOR Production, Prudhoe Bay Field, Alaska , by R. S. Tye, B. A. Watson, P. L. McGuire, and M. M. Maguire, Pages 113 - 125, in A(500 × 264 (41 KB)) - 18:09, 7 December 2015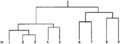
File:Multivariate-data-analysis fig2.png ...revious group of two (1 is aggregated to 2 and 3). At the next step, 4 and S constitutes a new group, which is then aggregated to the former group (1, 2(949 × 348 (7 KB)) - 00:51, 14 January 2014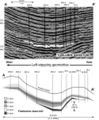
File:Mth14ch02f04.jpg ...est to east, perpendicular to the direction of sediment transport. From M. S. Clark, R. K. Prather, J. D. Melvin, 2003, Characterization and Exploitatio(500 × 605 (114 KB)) - 15:58, 4 December 2015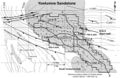
File:Mth14ch02f01.jpg ...relationship of Yowlumne Units A and B to the anticlinal closure. From M. S. Clark, R. K. Prather, J. D. Melvin, 2003, Characterization and Exploitatio(700 × 457 (103 KB)) - 23:18, 3 December 2015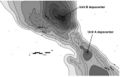
File:Mth14ch02f07.jpg ...resenting separate compartments with different oil-water contacts. From M. S. Clark, R. K. Prather, J. D. Melvin, 2003, Characterization and Exploitatio(700 × 449 (53 KB)) - 19:56, 4 December 2015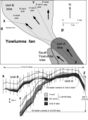
File:Mth14ch02f05.jpg ...l relief between oil-water contacts in the lobes of Units A and B. From M. S. Clark, R. K. Prather, J. D. Melvin, 2003, Characterization and Exploitatio(500 × 682 (64 KB)) - 17:07, 4 December 2015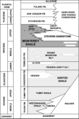
File:Mthch02f02.jpg ...the main source rock for most of the oil produced from the basin. From M. S. Clark, R. K. Prather, J. D. Melvin, 2003, Characterization and Exploitatio(300 × 453 (36 KB)) - 15:19, 4 December 2015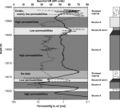
File:Mth14ch02f09.jpg ...creation of reservoir permeability pathways that parallel bedding. From M. S. Clark, R. K. Prather, J. D. Melvin, 2003, Characterization and Exploitatio(600 × 541 (60 KB)) - 20:21, 4 December 2015
File:Mth14ch07f03.jpg ...esigns Boost Primary and EOR Production, Prudhoe Bay Field, Alaska , by R. S. Tye, B. A. Watson, P. L. McGuire, and M. M. Maguire, Pages 113 - 125, in A(700 × 409 (77 KB)) - 17:55, 7 December 2015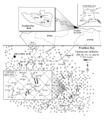
File:Mth14ch07f01.jpg ...esigns Boost Primary and EOR Production, Prudhoe Bay Field, Alaska , by R. S. Tye, B. A. Watson, P. L. McGuire, and M. M. Maguire, Pages 113 - 125, ''in(700 × 809 (135 KB)) - 17:34, 7 December 2015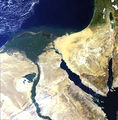
File:NileDelta.jpg ...image. The grey area to the bottom of the "triangle" of the delta is Egypt's Capitol, Cairo.(689 × 700 (161 KB)) - 18:06, 15 August 2014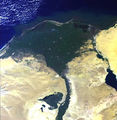
File:MainPageNileDelta.jpg ...image. The grey area to the bottom of the "triangle" of the delta is Egypt's Capitol, Cairo.(390 × 400 (166 KB)) - 19:55, 6 April 2015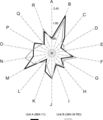
File:Mth14ch02f08.jpg ...s Talukdar, Core Laboratories, Inc., written communication, 1998). From M. S. Clark, R. K. Prather, J. D. Melvin, 2003, Characterization and Exploitatio(400 × 465 (28 KB)) - 20:19, 4 December 2015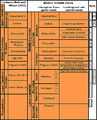
File:M98Ch3Fig3.JPG ...ian–Ordovician great American carbonate bank, in J. R. Derby, R. D. Fritz, S. A. Longacre, W. A. Morgan, and C. A. Sternbach, eds., The great American c(600 × 743 (211 KB)) - 16:39, 19 August 2014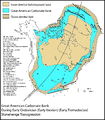
File:M98Ch2Fig1.JPG ...y Tremadocian): The Stonehenge transgression, in J. R. Derby, R. D. Fritz, S. A. Longacre, W. A. Morgan, and C. A. Sternbach, eds., The great American c(800 × 915 (269 KB)) - 16:14, 19 August 2014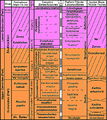
File:M98Ch3Fig5.JPG ...ian–Ordovician great American carbonate bank, in J. R. Derby, R. D. Fritz, S. A. Longacre, W. A. Morgan, and C. A. Sternbach, eds., The great American c(600 × 674 (275 KB)) - 16:53, 19 August 2014
File:M115CH02FG03.jpg ...; K = Kingfisher; L = Larch; M = Miller; NB = North Brae; SB = South Brae; S = Sycamore; Th = Thelma; Ti = Tiffany; To = Toni. From AAPG Memoir 115—Ri(700 × 767 (157 KB)) - 21:29, 10 January 2019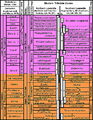
File:M98Ch3Fig4.JPG ...ian–Ordovician great American carbonate bank, in J. R. Derby, R. D. Fritz, S. A. Longacre, W. A. Morgan, and C. A. Sternbach, eds., The great American c(600 × 775 (326 KB)) - 16:42, 19 August 2014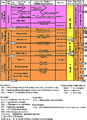
File:M98Ch3Fig1.JPG ...ian–Ordovician great American carbonate bank, in J. R. Derby, R. D. Fritz, S. A. Longacre, W. A. Morgan, and C. A. Sternbach, eds., The great American c(600 × 828 (256 KB)) - 16:27, 19 August 2014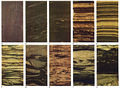
File:M31F18.jpg ...aminations common in the distal bar deposits. F. Lenticular sand laminatio s representing "starved current ripples" and small-scale ripple laminations c(1,349 × 994 (1.86 MB)) - 18:16, 18 August 2014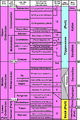
File:M98Ch3Fig2.JPG ...ian–Ordovician great American carbonate bank, in J. R. Derby, R. D. Fritz, S. A. Longacre, W. A. Morgan, and C. A. Sternbach, eds., The great American c(600 × 898 (278 KB)) - 16:31, 19 August 2014


