Search results
Jump to navigation
Jump to search
File:3.png ...ing facies association A and B, by Tomassini et al. (2014). A) mixed ramp. B) siliciclastic platform.(480 × 357 (68 KB)) - 16:50, 26 June 2015
File:DiapirDiagram.JPG ...contour map drawn on the J horizon. (c) Structure contour map drawn on the B horizon. From AAPG Bulletin, V. 91, No. 3 (March 2007), P. 343-363, by Hong(800 × 870 (270 KB)) - 17:59, 2 January 2015
File:GumelarFigure8.jpg ...xamples of leaks from a major structure. HCH in a) has a lower height than b). c) has a spill point value that is above the crest depth so that no leaka(870 × 540 (75 KB)) - 20:33, 28 October 2021
File:Fluid-contacts fig4.png .... Sharp changes in saturation correspond to elevations of facies changes. (b) Oil-water contact corresponding to capillary pressure curves. The free wat(1,924 × 933 (108 KB)) - 01:52, 14 January 2014
File:Fluid-contacts fig5.png ...on difference between contacts 1 and 2. The displacement pressure of fault B results in the elevation difference between contacts 1 and 3. The displacem(1,908 × 1,034 (76 KB)) - 01:52, 14 January 2014
File:Workovers fig5.png Wireline equipment, (a) Lubricator, (b) Typical string.(933 × 1,434 (53 KB)) - 21:50, 14 January 2014
File:Applied-paleontology fig17-29.png ...e adapted from Berggren et al., 1985a, <xref ref-type="bibr" rid="ch17r13">b}} ...e adapted from Berggren et al., 1985a, <xref ref-type="bibr" rid="ch17r13">b.(773 × 1,259 (209 KB)) - 16:03, 18 January 2014
File:M31F5.jpg ...its. From Deltaic environments of deposition, 1981, Coleman, J. M., and D. B. Prior, in AAPG Memoir 31.(1,152 × 941 (941 KB)) - 19:33, 15 August 2014
File:GumelarFigure9.jpg a) HCH from constant burial depth & b) using the formula Bretan, P. et al (2003).(828 × 316 (78 KB)) - 20:42, 28 October 2021
File:M31F2.jpg ...ons. From Deltaic environments of deposition, 1981, Coleman, J. M., and D. B. Prior, in AAPG Memoir 31.(365 × 772 (175 KB)) - 18:56, 15 August 2014
File:Wellbore-trajectory fig7.png (a) Packed bottom hole assembly, (b) Fulcrum effect for build angle.(900 × 1,089 (37 KB)) - 21:19, 14 January 2014
File:H4CH12FG11.JPG ...2012, Hicks, P. J. Jr., C. M. Fraticelli, J. D. Shosa, M. J. Hardy, and M. B. Townsley, in Peters, Kenneth E., David J. Curry, and Marek Kacewicz, eds.,(600 × 322 (73 KB)) - 21:40, 13 July 2015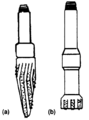
File:Fishing fig7.png (a) Tapered mill, (b) Flat mill.(595 × 801 (17 KB)) - 01:50, 14 January 2014
File:Introduction-to-contouring-geological-data-with-a-computer fig1.png (a) Random points. (b) Clustered points.(947 × 524 (13 KB)) - 22:06, 13 January 2014
File:Seismic-data-acquisition-on-land fig5.png (a) Off end shooting. (b) Split spread shooting.(1,669 × 506 (9 KB)) - 16:16, 14 January 2014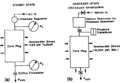
File:Permeability fig4.png Schematic diagram of (a) steady-state and (b) unsteady-state apparatus.(934 × 647 (32 KB)) - 18:02, 14 January 2014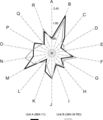
File:Mth14ch02f08.jpg ...Units A and B are not in fluid communication with each other, Units A and B appear to represent separate reservoir compartments (Suhas Talukdar, Core L(400 × 465 (28 KB)) - 20:19, 4 December 2015
File:Core-alteration-and-preservation fig1.png {{copyright|reservoir to surface. (a)Oil-productive formation. (b) Gas-productive formation. (Courtesy of Core Laboratories, a Division of We ...d contents. Copyright: reservoir to surface. (a)Oil-productive formation. (b) Gas-productive formation. (Courtesy of Core Laboratories, a Division of We(1,954 × 1,054 (65 KB)) - 22:38, 13 January 2014
File:Seismic-migration fig6.png (a) Unmigrated and (b) migrated stack of DMO-processed data from the Gulf of Mexico.(1,007 × 1,114 (690 KB)) - 19:35, 14 January 2014
File:Production-logging fig4.png Two types of flowmeters, (a) Full bore flowmeter, (b) Diverting basket type flowmeter.(1,963 × 1,194 (48 KB)) - 16:37, 14 January 2014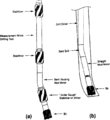
File:Wellbore-trajectory fig6.png (a) Steerable bottom hole assembly, (b) Kicking off with a bent sub and straight mud motor.(890 × 974 (33 KB)) - 21:19, 14 January 2014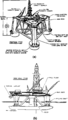
File:Offshore-rigs fig3.png Semisubmersible rigs, (a) Pontoon type semisubmersible. (b) Twin hull semisubmersible. (From Whittaker, 1985.)(942 × 1,663 (39 KB)) - 17:16, 14 January 2014
File:M31F27.jpg ...its. ote the lack of disturbance in these deposits. Coleman, J. M., and D. B. Prior, 1981, Deltaic environments of deposition ''in'' P. A. Scholle and D(760 × 1,372 (583 KB)) - 18:23, 18 August 2014
File:Using-and-improving-surface-models-built-by-computer fig8.png Cross sections showing that surfaces that intersect due to (a) baselap or (b) truncation will incorrectly cross one another.(837 × 343 (9 KB)) - 22:32, 13 January 2014
File:Pressure-transient-testing fig5.png (a) Typical buildup curve shape with flow barrier, (b) Doubling of slope on Horner plot for well near barrier.(1,955 × 806 (48 KB)) - 18:23, 14 January 2014
File:M31F1.jpg ...tem. From Deltaic environments of deposition, 1981, Coleman, J. M., and D. B. Prior, in AAPG Memoir 31.(744 × 591 (256 KB)) - 18:15, 15 August 2014
File:AlHawajAlQahtaniFigure6.jpg ...7] A) Faulted horizon surface. The small black box is the location of B-E. B-D) Channels lateral geometry on different horizon levels. E) Restoration us(468 × 439 (80 KB)) - 21:05, 8 November 2021
File:AlsaudKatterbauerFigure5.jpg ...se EM resistivity image between OBS1 and OBS2. (A) before water injection (B) After four months of water injection(624 × 338 (79 KB)) - 22:14, 3 February 2022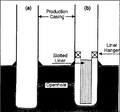
File:Well-completions fig1.png Wellbore diagram of (a) an open hole completion and (b) a slotted liner completion.(947 × 882 (40 KB)) - 21:20, 14 January 2014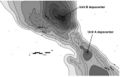
File:Mth14ch02f07.jpg ...depositional accumulations, an interpretation consistent with Units A and B representing separate compartments with different oil-water contacts. From(700 × 449 (53 KB)) - 19:56, 4 December 2015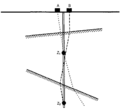
File:Checkshots-and-vertical-seismic-profiles fig3.png The source position (A or B) should be chosen so that the travel path to each receiver is as nearly ver(945 × 875 (8 KB)) - 21:28, 13 January 2014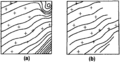
File:Using-and-improving-surface-models-built-by-computer fig1.png ...he same surface data. (a) Unconstrained extrapolation into nondata areas. (b) Contours constrained to areas near data.(923 × 479 (31 KB)) - 22:32, 13 January 2014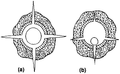
File:Well-completions fig10.png Qualitative description of perforations using (a) a casing gun and (b) a thru-tubing gun.(901 × 556 (29 KB)) - 21:20, 14 January 2014
File:Subsurface-maps fig4.png (a) Cross section and (b) net pay Isopach map of the Strachan gas field, western Canada. Contour Int(890 × 1,386 (78 KB)) - 20:42, 14 January 2014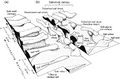
File:AlHawajAlQahtaniFigure5.jpg Schematic 3D geometry of salt structures rising from a) line sources and b) point sources. Note the complexity in all directions resulting from salt d(475 × 311 (57 KB)) - 21:01, 8 November 2021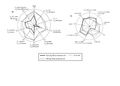
File:AlfraihAlSaifFigure7.jpg A spider diagram illustrating source parameters. A) Aliphatic hydrocarbons, b) aromatic hydrocarbons from oil inclusions and crude oil.(2,100 × 1,500 (487 KB)) - 19:15, 31 January 2022
File:M114CH01FG02.jpg Generalized pre-Mesozoic stratigraphic column for (A) northwest and (B) east-central Saudi Arabian Basin. From AAPG Memoir 114: Petroleum Systems(700 × 619 (117 KB)) - 19:52, 31 December 2018
File:M31F4.jpg ...its. From Deltaic environments of deposition, 1981, Coleman, J. M., and D. B. Prior, in AAPG Memoir 31.(1,464 × 916 (326 KB)) - 19:19, 15 August 2014
File:Three-dimensional-seismic-method fig1.png {{copyright|a marine 3-D survey. (b) The corresponding 2-D migrated section. (c) The 3-D migrated section. (Dat (a) A CMP-stacked section. Copyright: a marine 3-D survey. (b) The corresponding 2-D migrated section. (c) The 3-D migrated section. (Dat(943 × 2,518 (143 KB)) - 19:36, 14 January 2014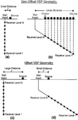
File:Checkshots-and-vertical-seismic-profiles fig4.png Examples of the source-receiver positions involved in (a and b) zero offset and (c and d) offset VSP recording geometries.(942 × 1,445 (56 KB)) - 21:29, 13 January 2014
File:Sem-xrd-cl-and-xf-methods fig6.png (a) X-ray fluoroscopy slab photograph and (b) plane light slab photograph of a Pennsylvanian sandstone from Oklahoma.(1,034 × 1,598 (1.16 MB)) - 22:29, 14 January 2014
File:GumelarFigure7.jpg ...ation ability for sealing capacity in reservoir (a) Clay Smear Potential; (b) Shale Gouge Ratio; (c) Shale Smear Factor (Yielding et al, 1997).(880 × 256 (64 KB)) - 17:25, 29 September 2021
File:GumelarFigure5.jpg ...mple normal fault with increasing linear displacement from left to right. (B) Generic juxtaposition diagram with the order of the footwall completely of(738 × 488 (85 KB)) - 23:10, 28 September 2021
File:Evaluating-tight-gas-reservoirs fig3.png Histograms showing (a) average porosity values and (b) average permeability values for cored tight gas reservoir facies. (From Mo(1,964 × 879 (37 KB)) - 18:47, 14 January 2014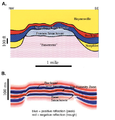
File:Reef1.png (A) Geologic model used in seismic modeling of Figure 7 and (B) seismic section of the structure at Appleton field (modified from Balch an(471 × 491 (248 KB)) - 16:08, 20 November 2014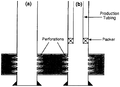
File:Well-completions fig3.png Wellbore diagram of (a) a perforated completion and (b) a single completion inside perforated casing.(940 × 683 (34 KB)) - 21:20, 14 January 2014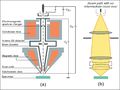
File:Figure-1.jpg ...f the GEMINI electron column (a) and the electron beam path in the column (b). From DOI: 10.1306/13391699M1023580(961 × 723 (47 KB)) - 17:17, 15 August 2014
File:Land-description-and-maps fig1.png ...icial plat of township sectionized and numbered, with adjoining sections. (b) Official plan of numbering Congressional Townships from meridians and base(964 × 2,127 (81 KB)) - 16:15, 14 January 2014
File:M31F14v2.jpg ...ng the uppermost part of the channel-fill deposits. Coleman, J. M., and D. B. Prior, 1981, Deltaic environments of deposition in P. A. Scholle and D. Sp(1,134 × 503 (75 KB)) - 15:16, 18 August 2014
File:Wireline-formation-testers fig1.png Wireline formation tester. (a) Retracted configuration (tool closed). (b) Set configuration (tool set).(924 × 867 (21 KB)) - 21:44, 14 January 2014


