Search results
Jump to navigation
Jump to search
Page title matches
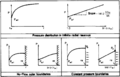
File:Fundamentals-of-fluid-flow fig4.png (950 × 610 (32 KB)) - 01:52, 14 January 2014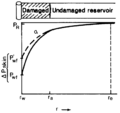
File:Fundamentals-of-fluid-flow fig5.png (818 × 769 (22 KB)) - 01:52, 14 January 2014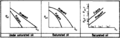
File:Fundamentals-of-fluid-flow fig6.png (944 × 296 (22 KB)) - 01:52, 14 January 2014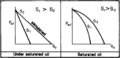
File:Fundamentals-of-fluid-flow fig7.png (942 × 453 (24 KB)) - 01:52, 14 January 2014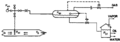
File:Fundamentals-of-fluid-flow fig1.png (908 × 320 (14 KB)) - 01:52, 14 January 2014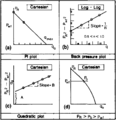
File:Fundamentals-of-fluid-flow fig2.png (948 × 984 (17 KB)) - 01:52, 14 January 2014
File:Fundamentals-of-fluid-flow fig3.png (887 × 260 (6 KB)) - 01:52, 14 January 2014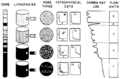
File:Flow-units-for-reservoir-characterization fig1.png ...ability barriers that can be mapped at the same scale as reservoir quality flow units.(1,487 × 976 (91 KB)) - 23:13, 14 January 2014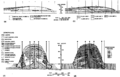
File:Flow-units-for-reservoir-characterization fig2.png ...dified from Hearn et al., 1984.) (c) Lithofacies and (d) reservoir facies (flow unit) subdivision of the Rainbow Lake reef reservoir (“A” Pool), Albert(2,737 × 1,751 (237 KB)) - 23:14, 14 January 2014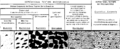
File:Carbonate-reservoir-models-facies-diagenesis-and-flow-characterization fig1.png (1,969 × 809 (53 KB)) - 19:02, 13 January 2014
File:Carbonate-reservoir-models-facies-diagenesis-and-flow-characterization fig2.png (2,773 × 1,788 (136 KB)) - 19:02, 13 January 2014
File:Carbonate-reservoir-models-facies-diagenesis-and-flow-characterization fig3.png (1,424 × 2,558 (219 KB)) - 19:02, 13 January 2014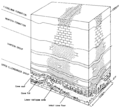
File:Carbonate-reservoir-models-facies-diagenesis-and-flow-characterization fig4.png (1,827 × 1,643 (189 KB)) - 19:02, 13 January 2014


Page text matches
File:Flow-units-for-reservoir-characterization fig1.png ...ability barriers that can be mapped at the same scale as reservoir quality flow units.(1,487 × 976 (91 KB)) - 23:13, 14 January 2014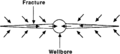
File:Stimulation fig3.png Flow to fractured well is linear to fracture, followed by flow that is down fracture to the wellbore.(881 × 399 (13 KB)) - 20:37, 14 January 2014File:Flow-units-for-reservoir-characterization fig2.png ...dified from Hearn et al., 1984.) (c) Lithofacies and (d) reservoir facies (flow unit) subdivision of the Rainbow Lake reef reservoir (“A” Pool), Albert(2,737 × 1,751 (237 KB)) - 23:14, 14 January 2014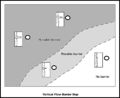
File:M91FG102.JPG ...rriers are effective across the reservoir can be characterized by vertical flow barrier maps.(800 × 653 (39 KB)) - 21:20, 12 August 2015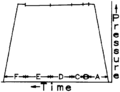
File:Drill-stem-testing fig7.png ...) running in hole; (B) initial flow period; (C) initial buildup; (D) final flow period; (E) final buildup; and (F) pulling out of hole.(728 × 559 (6 KB)) - 22:25, 14 January 2014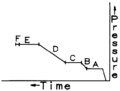
File:Drill-stem-testing fig3.png ...un in hole; (B) initial flow period; (C) initial shut-in period; (D) final flow period; (E) final shut-in period; and (F) pulling out of hole.(748 × 570 (5 KB)) - 22:25, 14 January 2014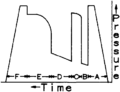
File:Drill-stem-testing fig6.png ...ure of mud column; (B) initial flow period; (C) initial buildup; (D) final flow period; (E) final buildup; and (F) release packer and pulling out of hole.(724 × 556 (6 KB)) - 22:25, 14 January 2014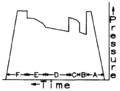
File:Drill-stem-testing fig8.png ...l not replicate gauges run above the bottom packer because of a restricted flow area around the packer elements. (Types of gauge failures are described in(755 × 573 (6 KB)) - 22:25, 14 January 2014
File:Conducting-a-reservoir-simulation-study-an-overview fig5.png ...permeabilities calculated for series flow (geometric average) and parallel flow (arithmetic average). Copyright: Lishman, 1970</xref>; Courtesy Canadian In(854 × 1,328 (69 KB)) - 18:46, 14 January 2014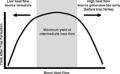
File:H4CH12FG8.JPG ...t day and a limited amount of hydrocarbon is generated, and at a high heat flow, the source rock is depleted before the trap forms. From Identifying and qu(600 × 372 (49 KB)) - 20:32, 13 July 2015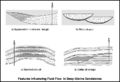
File:M91FG194.JPG Features influencing fluid flow in deep-marine sandstones.(800 × 544 (69 KB)) - 15:35, 17 August 2015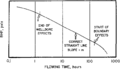
File:Pressure-transient-testing fig3.png Typical flow test data graph.(934 × 536 (9 KB)) - 18:23, 14 January 2014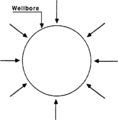
File:Stimulation fig2.png Flow to unfractured well converges at wellbore.(823 × 838 (12 KB)) - 20:37, 14 January 2014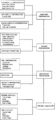
File:Two-dimensional-geophysical-workstation-interpretation-generic-problems-and-solutions fig5.png General flow chart for project preparation.(940 × 2,048 (73 KB)) - 15:37, 14 January 2014
File:Production-testing fig2.png Multi-point test used to estimate absolute open flow potential.(939 × 770 (24 KB)) - 17:29, 14 January 2014
File:AlAhmadiTawfiqFigure10.jpg Lean gas condensate well test behavior with increasing and decreasing flow rates (Gringarten, Bozorgzadeh, Hashemi, & Daungkaew, 2006).(660 × 776 (114 KB)) - 23:23, 9 November 2021
File:Oil-and-condensate-analysis fig1.png Flow diagram showing the basic steps followed in oil-oil correlations using gas(1,954 × 747 (25 KB)) - 17:17, 14 January 2014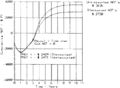
File:Key-economic-parameters fig2.png Undiscounted and discounted cumulative net cash flow streams for example multiwell extension project.(948 × 698 (37 KB)) - 19:19, 14 January 2014
File:Pressure-transient-testing fig5.png (a) Typical buildup curve shape with flow barrier, (b) Doubling of slope on Horner plot for well near barrier.(1,955 × 806 (48 KB)) - 18:23, 14 January 2014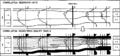
File:Reservoir-modeling-for-simulation-purposes fig4.png Correlation of reservoir units and subdivision of reservoir In flow units.(1,943 × 901 (33 KB)) - 14:35, 14 January 2014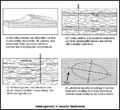
File:M91FG171.JPG The influence on fluid flow by heterogeneity in eolian sediments. From From Shepherd, M., 2009, Eolian(800 × 734 (138 KB)) - 17:18, 29 July 2015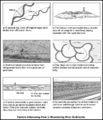
File:M91FG176.JPG Flow geology influences in meandering river sediments. From Shepherd, M., 2009,(800 × 929 (161 KB)) - 20:28, 3 August 2015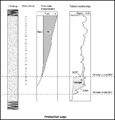
File:M91Ch6FG45.JPG Production logs are run in a producing well to determine downhole flow rates and to evaluate reservoir sweep. From Shepherd, M., 2009, Sources of(800 × 838 (77 KB)) - 17:13, 3 June 2015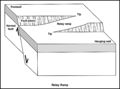
File:M91Ch13FG86.JPG ...etween two overlapping faults. They potentially provide pathways for fluid flow across a fault zone (from Peacock and Sanderson, 1994). From Shepherd, M.,(600 × 444 (30 KB)) - 21:35, 29 April 2015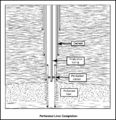
File:M91Ch2.JPG ...he liner is then selectively perforated with holes so as to allow fluid to flow into the wellbore from the specific zones required for production. From She(800 × 831 (175 KB)) - 21:14, 22 April 2015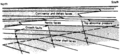
File:Pressure-detection fig1.png ...re fluids cannot escape. The growth faults are seals that stop the lateral flow of pore water toward the neritic facies. (From Dickey et al., 1968.)(930 × 425 (53 KB)) - 18:22, 14 January 2014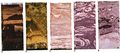
File:M31F14v2.jpg ...s in silty clay layers of a channel-fill deposit. D. Contorted bedding and flow rolls in sands and sandy silt deposits of the channel fill. E. High organic(1,134 × 503 (75 KB)) - 15:16, 18 August 2014


