Search results
Jump to navigation
Jump to search
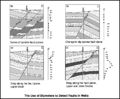
File:M91Ch13FG80.JPG ...can be used to pick likely fault planes in wells. Changes in dip amplitude or azimuth can indicate that a fault is present. Drag patterns may also be see(800 × 660 (102 KB)) - 21:14, 29 April 2015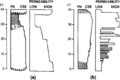
File:Geological-heterogeneities fig2.png ...ermeability profiles of (a) fining- or thinning-upward and (b) coarsening- or thickening-upward sequences. ''Fining'' and ''coarsening'' refer to average(940 × 630 (40 KB)) - 15:35, 14 January 2014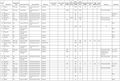
File:M106Ch12Table2b.jpg ...ce strata type: basinal marine (includes calcareous and marly lithologies) or basinal shale. Volumes of oil and gas in-place, estimated ultimate recovera(700 × 474 (70 KB)) - 15:30, 12 May 2016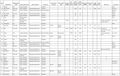
File:M106Ch12Table2.jpg ...ce strata type: basinal marine (includes calcareous and marly lithologies) or basinal shale. Volumes of oil and gas in-place, estimated ultimate recovera(700 × 442 (69 KB)) - 15:28, 12 May 2016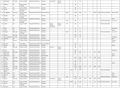
File:M106Ch12Table2a.jpg ...ce strata type: basinal marine (includes calcareous and marly lithologies) or basinal shale. Volumes of oil and gas in-place, estimated ultimate recovera(700 × 515 (83 KB)) - 15:29, 12 May 2016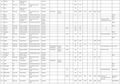
File:M106Ch12Table2c.jpg ...ce strata type: basinal marine (includes calcareous and marly lithologies) or basinal shale. Volumes of oil and gas in-place, estimated ultimate recovera(700 × 489 (73 KB)) - 15:30, 12 May 2016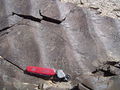
File:1024px-WaveRipple.JPG Wave ripple or symmetric ripple, from Permian rocks in Nomgon, Mongolia. Photo by Matt Aff(1,024 × 768 (251 KB)) - 20:29, 22 December 2014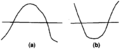
File:Using-and-improving-surface-models-built-by-computer fig8.png Cross sections showing that surfaces that intersect due to (a) baselap or (b) truncation will incorrectly cross one another.(837 × 343 (9 KB)) - 22:32, 13 January 2014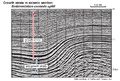
File:ST53 Part01 Pg11A.jpg ...thin toward the structural high. Growth strata are generally folded in one or more limbs of the structure. In this seismic section, growth strata thin on(750 × 509 (230 KB)) - 16:23, 28 July 2015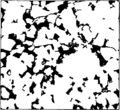
File:Reservoir-quality fig1.png ...raphic image of sandstone. Dark areas are pores and light areas are grains or cement.(950 × 868 (20 KB)) - 18:46, 14 January 2014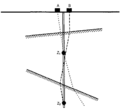
File:Checkshots-and-vertical-seismic-profiles fig3.png The source position (A or B) should be chosen so that the travel path to each receiver is as nearly v(945 × 875 (8 KB)) - 21:28, 13 January 2014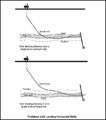
File:M91Figure162.JPG ...encountered with landing a horizontal well if the target zone is too high or too low compared to what is predicted. From Chapter 28, AAPG Memoir 91, by(600 × 682 (38 KB)) - 19:32, 30 July 2014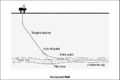
File:M91Figure161.JPG ..., with the intent of keeping the well within a specific reservoir interval or hydrocarbon zone. From Chapter 28, AAPG Memoir 91, by Mike Shepherd(800 × 534 (36 KB)) - 19:25, 30 July 2014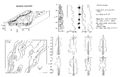
File:M31F3.jpg ...of braided channel deposits (letters on the vertical section refer to core or outcrop photographs). From Deltaic environments of deposition, 1981, Colema(2,941 × 1,884 (830 KB)) - 19:02, 15 August 2014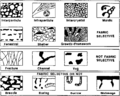
File:Porosity fig3.png ...osity groups: fabric selective, not fabric selective, and fabric selective or not. (After Choquette and Pray, 1970.)(950 × 757 (24 KB)) - 18:19, 14 January 2014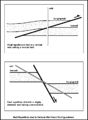
File:M91Ch13FG82.JPG ...ed sections can be seen in a vertical well drilled through a reverse fault or with a highly deviated well penetrating a normal fault. From Shepherd, M.,(600 × 820 (92 KB)) - 21:16, 29 April 2015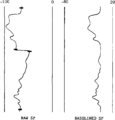
File:Log-analysis-applications fig2.png ...tive points, SP deflections are calculated and redisplayed as a baselined (or “static”) SP.(939 × 983 (9 KB)) - 16:36, 14 January 2014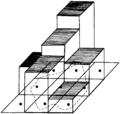
File:Using-and-improving-surface-models-built-by-computer fig18.png The cell is centered on the grid node and lies either inside or outside the polygon. The cell's area is multiplied by its z value (thicknes(835 × 790 (37 KB)) - 22:32, 13 January 2014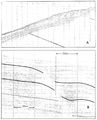
File:M31F25.jpg ...m between shot points and vertical scale is 10 milliseconds per time line, or 7.6 m (25 ft). Coleman, J. M., and D. B. Prior, 1981, Deltaic environments(1,087 × 1,348 (940 KB)) - 18:21, 18 August 2014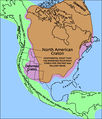
File:NacratonUSGS.jpg ...million years or so. Continents can grow when two plates collide, welding, or accreting, the two pieces together. Continents also grow when oceanic crust(512 × 599 (332 KB)) - 15:27, 19 August 2014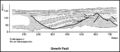
File:M91Ch13FG94.JPG ...on in areas with thick delta sequences and mobile substrates such as shale or salt. This example is from Upper Triassic deltaic sediments exposed in the(800 × 345 (49 KB)) - 21:41, 29 April 2015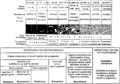
File:Thin-section-analysis fig2.png ...9) and (b) Dunham (1962), both based on textures observed in hand specimen or thin section. In Folk's scheme, the black pattern represents lime mud matri(1,959 × 1,366 (182 KB)) - 21:07, 14 January 2014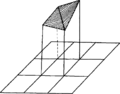
File:Using-and-improving-surface-models-built-by-computer fig19.png The cell's corners are defined by grid nodes. The top is defined by two or more planes passing through the node z values and lie inside the polygon. T(817 × 641 (22 KB)) - 22:32, 13 January 2014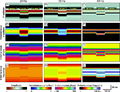
File:AAPGBullFeb2013ZengFigure4.JPG ...ulated with 90deg Ricker wavelets of 20-, 35-, and 80-Hz peak frequencies (or 26-, 45.5-, and 104-Hz predominant frequencies, respectively). No noise is(800 × 613 (224 KB)) - 18:22, 30 June 2014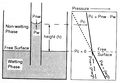
File:Charles-l-vavra-john-g-kaldi-robert-m-sneider capillary-pressure 2.jpg The wetting phase rises above the original or free surface in the capillary tube experiment until adhesive and gravitatio(1,200 × 828 (279 KB)) - 17:41, 13 September 2013
File:Geological-cross-sections fig2.png ...o make the cross section more compact. The left track of each log is an SP or gamma ray trace and the right track is a resistivity trace. (From Slatt et(1,921 × 1,041 (171 KB)) - 15:32, 14 January 2014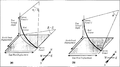
File:Conversion-of-well-log-data-to-subsurface-stratigraphic-and-structural-information fig5.png ...les. This method assumes a constant radius of curvature (constant increase or decrease in deviation between survey points). (b) Minimum curvature method(1,968 × 1,106 (119 KB)) - 16:38, 14 January 2014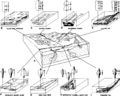
File:Lithofacies-and-environmental-analysis-of-clastic-depositional-systems fig3.png Models of major depositional environments. The curve on the left shows the SP or gamma ray response and the curve on the right shows the relative grain size(1,950 × 1,563 (201 KB)) - 21:37, 13 January 2014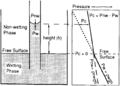
File:Capillary-pressure fig2.png The wetting phase rises above the original or free surface in the capillary tube experiment until adhesive and gravitatio(947 × 675 (25 KB)) - 18:22, 14 January 2014
File:M114CH10FG02.jpg ...structural spillpoint and the hydrocarbon–water contact) and (B) shows to or deeper than the structural spillpoint (presented as the vertical distance b(641 × 652 (54 KB)) - 23:02, 8 January 2019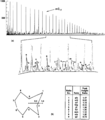
File:Oil-and-condensate-analysis fig5.png ...fferent attenuations, (b) as star diagrams of selected peak height ratios, or (c) as data tables of peak height ratios. The star diagram is a polar plot(1,942 × 2,226 (120 KB)) - 17:17, 14 January 2014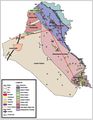
File:M106Ch12Fig03.jpg ...owing major structural features. Fields and significant wells with oil and/or gas shows are shown; numbers refer to Tables 1–5 in [[Iraq petroleum geol(700 × 902 (78 KB)) - 13:57, 12 May 2016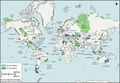
File:GiacomoneEtAlFigure1.jpg ...super basins (those with less than 5 billion BOE of cumulative production or remaining recoverable oil and gas) are shown in light blue. DwGoM = deep-wa(868 × 600 (145 KB)) - 20:51, 28 October 2021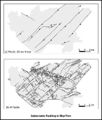
File:M91Ch13FG93.JPG ...field, United Kingdom. In map (a), only faults with throws of 20 m (64 ft) or more are shown. These are equivalent to faults that are detectable by seism(600 × 704 (72 KB)) - 21:40, 29 April 2015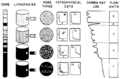
File:Flow-units-for-reservoir-characterization fig1.png ...unit, it is permissible to define a flow unit that exhibits only weak flow or no flow through it. This property of flow units makes it possible to use a(1,487 × 976 (91 KB)) - 23:13, 14 January 2014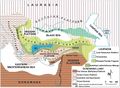
File:M106Ch13Fig01.jpg ...en recognized and described which correspond to either a continental block or a suture zone that is amalgamated as a result of the Neo-Tethyan collision(700 × 513 (90 KB)) - 19:29, 5 July 2016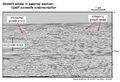
File:ST53Part01Pg11B.jpg ...rata are generally not present above the fold crest, but are folded in one or more limbs of the structure. In this seismic section, growth strata onlap t(750 × 511 (141 KB)) - 16:33, 28 July 2015
File:Multivariate-data-analysis fig2.png ...and 3). Then, combine the two nearest groups by either joining two samples or aggregating a third sample to the previous group of two (1 is aggregated to(949 × 348 (7 KB)) - 00:51, 14 January 2014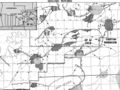
File:Mth14ch04f01.jpg ...of water. Dark gray indicates oil fields. Light gray refers to salt domes or tabular salt. From Results and Conclusions of a Horizontal-drilling Program(700 × 525 (111 KB)) - 16:00, 7 December 2015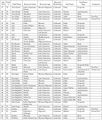
File:M106Ch12Table3.jpg ...), marl, dense limestone, evaporite-shale, and evaporite-marl. Alternative or old reservoir names provided in comments column. Field number refers to loc(700 × 823 (153 KB)) - 15:35, 12 May 2016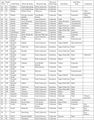
File:M106Ch12Table3a.jpg ...), marl, dense limestone, evaporite-shale, and evaporite-marl. Alternative or old reservoir names provided in comments column. Field number refers to loc(700 × 896 (147 KB)) - 15:36, 12 May 2016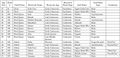
File:M106Ch12Table3b.jpg ...), marl, dense limestone, evaporite-shale, and evaporite-marl. Alternative or old reservoir names provided in comments column. Field number refers to loc(700 × 336 (63 KB)) - 15:36, 12 May 2016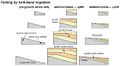
File:ST53Part01Pg12A.jpg ...ough an active axial surface, which at depth is generally pinned to a bend or tip of a fault (Suppe, 1983; Suppe and Medwedeff, 1990). The fold limb in g ...wer fold limbs than do older horizons, forming narrowing upward fold limbs or kink bands in growth strata (growth triangles). In the case where uplift ra(750 × 411 (83 KB)) - 16:36, 28 July 2015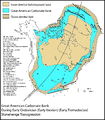
File:M98Ch2Fig1.JPG ...rred during deposition of the Early Ordovician Symphysurina trilobite Zone or during deposition of the Cordylodus angulatus and basal Rossodous manitouen(800 × 915 (269 KB)) - 16:14, 19 August 2014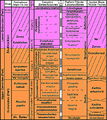
File:M98Ch3Fig5.JPG ...d B.D.I.) delineated through a combination of conodont and trilobite zonal or subzonal boundaries through the upper Sunwaptan, Skullrockian, and lowermos(600 × 674 (275 KB)) - 16:53, 19 August 2014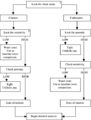
File:Mth16Ch7Figure7-1.jpg 2 Shaly zones might produce oil or gas even if they have low resistivity.(400 × 528 (39 KB)) - 16:08, 21 May 2014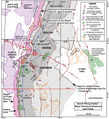
File:M115CH02FG03.jpg ...Ground Spur and Utsira High have pre-Upper Jurassic rocks beneath Cenozoic or Cretaceous strata (with very thin, <approximately 2 m [6.6 ft], KCF-Draupne(700 × 767 (157 KB)) - 21:29, 10 January 2019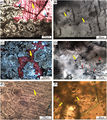
File:BLTN12220fig5.jpg ...ft). (E) Gas-stage TSR calcite (yellow arrow), with no evidence of bitumen or oil inclusions found in this type of calcite, suggesting that calcite was f(444 × 500 (324 KB)) - 13:22, 13 August 2014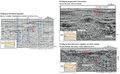
File:ST53Part01Pg13.jpg (left) The seismic section above shows a narrowing upward fold limb, or growth triangle, where bed dips within the fold limb generally do not shall(750 × 462 (163 KB)) - 20:31, 28 July 2015


