Search results
Jump to navigation
Jump to search
There is a page named "Shale" on this wiki. See also the other search results found.
Page title matches
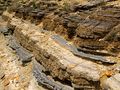
File:Oil-shale-Copy.jpg http://etv10news.com/first-commercial-oil-shale-mine-in-nation-to-be-housed-in-utah/(600 × 450 (198 KB)) - 20:40, 25 June 2014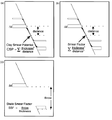
File:Shale-smear-factor-fig2.png (509 × 545 (23 KB)) - 19:21, 9 September 2014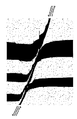
File:Shale Smear Factor Fig1.png (265 × 410 (16 KB)) - 20:17, 29 September 2014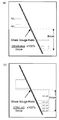
File:Shale-gouge-ratio-fig3.png (259 × 526 (18 KB)) - 16:23, 9 September 2014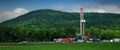
File:Shale-Gas-Discussion-Group-hero.jpg (640 × 268 (31 KB)) - 23:53, 19 January 2021
File:McCully shale New Brunswick rig.jpg (300 × 199 (30 KB)) - 16:17, 15 January 2014


Page text matches
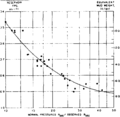
File:Pressure-detection fig4.png ...ly pressured shale divided by observed resistivity of abnormally pressured shale, plotted against formation pressure gradient (FPG) and equivalent mud weigh(926 × 899 (14 KB)) - 18:23, 14 January 2014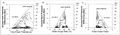
File:GumelarFigure7.jpg ...capacity in reservoir (a) Clay Smear Potential; (b) Shale Gouge Ratio; (c) Shale Smear Factor (Yielding et al, 1997).(880 × 256 (64 KB)) - 17:25, 29 September 2021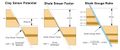
File:GumelarFigure6.jpg ...s in the fault plane. (a) Potential Clay Smear; (b) Shale Gouge Ratio; (c) Shale Smear Factor (redrawn from Yielding, 1997).(1,347 × 565 (92 KB)) - 17:25, 29 September 2021
File:Quick-look-lithology-from-logs fig1.png ...y. (c) Bell shape, fining upward. Note that coal is present in addition to shale.(945 × 1,311 (140 KB)) - 16:37, 14 January 2014
File:Figure4FayettevilleShale2019-20CommRpt.jpg Fayetteville Shale well completion numbers.(979 × 664 (114 KB)) - 22:22, 2 June 2021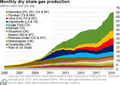
File:TightOilCommittee 2018-19 Figure2.jpg Monthly dry shale gas production (EIA, 2019).(468 × 331 (116 KB)) - 01:48, 20 January 2021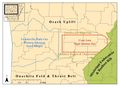
File:Figure1 FayettevilleShale2019-20CommRpt.jpg Primary area of the Fayetteville Shale exploration and development in Arkansas.(906 × 666 (131 KB)) - 22:21, 2 June 2021
File:Figure3 FayettevilleShale2019-20CommRpt.jpg Weekly drill rig numbers in the Fayetteville Shale gas play (2011-2019).(979 × 414 (96 KB)) - 22:22, 2 June 2021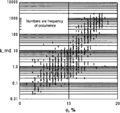
File:Core-log-transformations-and-porosity-permeability-relationships fig4.png ...ability versus helium porosity from North Sea sandstone, conglomerate, and shale.(941 × 890 (53 KB)) - 18:06, 14 January 2014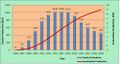
File:Figure2 FayettevilleShale2019-20CommRpt.jpg Annual and cumulative gas production of the Fayetteville Shale gas play.(979 × 529 (106 KB)) - 22:21, 2 June 2021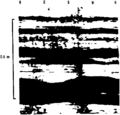
File:Borehole-imaging-devices fig4.png Borehole televiewer images showing shale layers (dark) intercalated with limestone layers (bright).(954 × 914 (16 KB)) - 18:53, 13 January 2014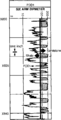
File:Dipmeters fig3.png Example of thin bed laminated sandstone-shale resolution by means of a dipmeter correlation curve.(941 × 1,852 (26 KB)) - 01:19, 14 January 2014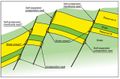
File:GumelarFigure1.jpg ...(fault blocks) of normal faults by the interbedded between sandstones and shale (modified Færseth, 2006).(594 × 390 (60 KB)) - 20:26, 28 September 2021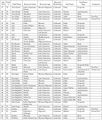
File:M106Ch12Table3.jpg ...anhydrite (arg limestone and anhydrite), marl, dense limestone, evaporite-shale, and evaporite-marl. Alternative or old reservoir names provided in comment(700 × 823 (153 KB)) - 15:35, 12 May 2016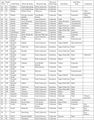
File:M106Ch12Table3a.jpg ...anhydrite (arg limestone and anhydrite), marl, dense limestone, evaporite-shale, and evaporite-marl. Alternative or old reservoir names provided in comment(700 × 896 (147 KB)) - 15:36, 12 May 2016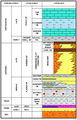
File:M115CH11FG05.jpg Simplified T-Block stratigraphy. Long. Sh. = Longicornis shale member. From AAPG Memoir 115—Rift-Related Coarse-Grained Submarine Fan Re(1,047 × 1,634 (744 KB)) - 15:22, 22 January 2019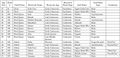
File:M106Ch12Table3b.jpg ...anhydrite (arg limestone and anhydrite), marl, dense limestone, evaporite-shale, and evaporite-marl. Alternative or old reservoir names provided in comment(700 × 336 (63 KB)) - 15:36, 12 May 2016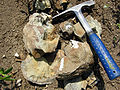
File:BrokenConcretion22.jpg A broken concretion with fossils inside; Upper Cretaceous Pierre shale, near Ekalaka, Montana. Photograph taken by Mark A. Wilson (Department of G(1,200 × 900 (698 KB)) - 16:20, 10 September 2014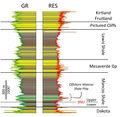
File:Figure1MancosCommRept.jpg ...tigraphic units. Note the interval commonly drilled in the Offshore Mancos Shale play. Modified from Hart (2021).(887 × 865 (285 KB)) - 20:49, 14 April 2021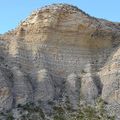
File:Eagle-ford-gets-spotlight04.jpg West Texas' Lozier Canyon offers an opportunity to examine Eagle Ford Shale outcrops at various scales across a sizable area. Photo by Art Donovan. Cou(400 × 400 (80 KB)) - 16:20, 18 June 2014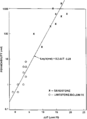
File:Full-waveform-acoustic-logging fig3.png ...-measured permeability values for both the limestone-dolomite and the sand-shale examples. (After Burns et al., 1988.)(948 × 1,299 (12 KB)) - 14:23, 29 August 2014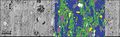
File:Figure-8.jpg A secondary electron image of a shale sample with an EDS-derived mineral segmentation overlay. In the segmented r(1,353 × 418 (106 KB)) - 17:34, 15 August 2014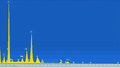
File:M102Ch1Fg7.jpg An example of an x-ray spectrum acquired from a shale sample. Individual peaks indicate an elevated concentration of a given elem(1,492 × 845 (1.24 MB)) - 22:24, 14 August 2014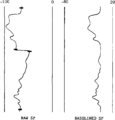
File:Log-analysis-applications fig2.png ...he raw SP curve, which represent zero deflection (that is, baseline = 100% shale). By projecting the baseline between two consecutive points, SP deflections(939 × 983 (9 KB)) - 16:36, 14 January 2014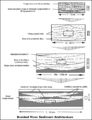
File:M91FG182.JPG Hierarchy of sandstone and shale bodies in braided river sediments from the Morrison Formation, Garfield Cou(800 × 1,040 (126 KB)) - 18:47, 12 August 2015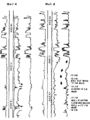
File:Pressure-detection fig3.png ...away and across a growth fault, showed a sudden decrease in resistivity of shale (increase in conductivity) at about 11,100 ft. Shortly thereafter, the well(912 × 1,211 (25 KB)) - 18:23, 14 January 2014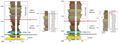
File:Figure2MancosCommRept.jpg Two examples of wells that produce from the Mancos Shale. The main completion target is an interval of the Upper Mancos that is some(1,679 × 617 (359 KB)) - 20:50, 14 April 2021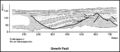
File:M91Ch13FG94.JPG ...e common in areas with thick delta sequences and mobile substrates such as shale or salt. This example is from Upper Triassic deltaic sediments exposed in t(800 × 345 (49 KB)) - 21:41, 29 April 2015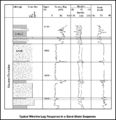
File:M91Ch6FG43.JPG Gamma-ray, density, neutron, and sonic log response of a sandstone and shale sequence. This example is from well 16/29a-9 in the Fleming field, UK North(800 × 827 (107 KB)) - 17:07, 3 June 2015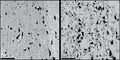
File:Figure-3.jpg A shale sample imaged using SE1 signal (left) and SE2 signal (right). Surface-speci(1,502 × 746 (180 KB)) - 17:32, 15 August 2014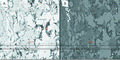
File:M102Ch1Fg4.jpg SE2 (a) and BSE1 (b) image of a cross section of a shale rock. Note that the contrast between carbonate (ca) and silica (si) grains(1,492 × 746 (1.74 MB)) - 21:56, 14 August 2014
File:M102Ch1Fg6.jpg (a) A BSE and CL image of a polished shale sample. Orange-hued quartz grains reflect low-grade(502 × 518 (978 KB)) - 22:08, 14 August 2014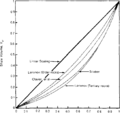
File:Standard-interpretation fig1.png Nonlinear shale volume chart. Copyright: Western Atlas International, 1985</xref>; courtesy(933 × 882 (15 KB)) - 20:29, 14 January 2014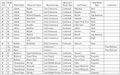
File:M106Ch12Table4.jpg ...tone. Seal strata type: evaporite, argillaceous limestone (arg limestone), shale, marl, and evaporite-marl. Field number refers to locations shown in Figure(700 × 438 (80 KB)) - 15:41, 12 May 2016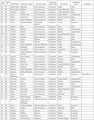
File:M106Ch12Table4a.jpg ...tone. Seal strata type: evaporite, argillaceous limestone (arg limestone), shale, marl, and evaporite-marl. Field number refers to locations shown in Figure(700 × 891 (157 KB)) - 15:41, 12 May 2016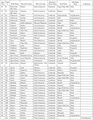
File:M106Ch12Table4c.jpg ...tone. Seal strata type: evaporite, argillaceous limestone (arg limestone), shale, marl, and evaporite-marl. Field number refers to locations shown in Figure(700 × 906 (160 KB)) - 15:42, 12 May 2016
File:M106Ch12Table4d.jpg ...tone. Seal strata type: evaporite, argillaceous limestone (arg limestone), shale, marl, and evaporite-marl. Field number refers to locations shown in Figure(700 × 423 (78 KB)) - 15:42, 12 May 2016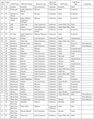
File:M106Ch12Table4b.jpg ...tone. Seal strata type: evaporite, argillaceous limestone (arg limestone), shale, marl, and evaporite-marl. Field number refers to locations shown in Figure(700 × 888 (149 KB)) - 15:41, 12 May 2016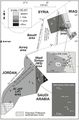
File:M106Ch07Fig04.jpg ...ion. Gamma-ray values in some wells have been adjusted according to offset shale baseline. From Lüning et al. (2006). 5 km (3.1 mi). From Lüning et al. (2(564 × 855 (75 KB)) - 20:49, 18 April 2016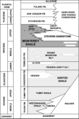
File:Mthch02f02.jpg ...s a deep-marine, clastic facies of the Monterey Formation, an organic-rich shale that is considered to be the main source rock for most of the oil produced(300 × 453 (36 KB)) - 15:19, 4 December 2015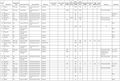
File:M106Ch12Table2b.jpg ...ype: basinal marine (includes calcareous and marly lithologies) or basinal shale. Volumes of oil and gas in-place, estimated ultimate recoverable (EUR), pro(700 × 474 (70 KB)) - 15:30, 12 May 2016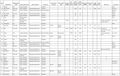
File:M106Ch12Table2.jpg ...ype: basinal marine (includes calcareous and marly lithologies) or basinal shale. Volumes of oil and gas in-place, estimated ultimate recoverable (EUR), pro(700 × 442 (69 KB)) - 15:28, 12 May 2016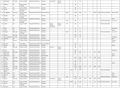
File:M106Ch12Table2a.jpg ...ype: basinal marine (includes calcareous and marly lithologies) or basinal shale. Volumes of oil and gas in-place, estimated ultimate recoverable (EUR), pro(700 × 515 (83 KB)) - 15:29, 12 May 2016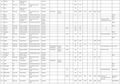
File:M106Ch12Table2c.jpg ...ype: basinal marine (includes calcareous and marly lithologies) or basinal shale. Volumes of oil and gas in-place, estimated ultimate recoverable (EUR), pro(700 × 489 (73 KB)) - 15:30, 12 May 2016


