Search results
Jump to navigation
Jump to search
Page title matches
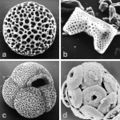
File:Marine-microfossils-major hg.jpg (600 × 600 (100 KB)) - 14:26, 4 January 2017

Page text matches
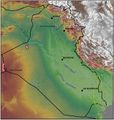
File:M106Ch12Fig01.jpg Topographic map of Iraq, showing major cities and rivers, along with major oil and gas fields. Points of high elevation are indicated. From Grabowski(700 × 735 (96 KB)) - 20:15, 11 May 2016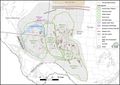
File:GiacomoneEtAlFigure6.jpg Location map of the Permian Basin, with its major structural features and drilled wells.(744 × 524 (88 KB)) - 20:03, 29 October 2021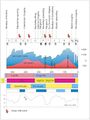
File:M106Ch01Fig01.jpg ...global sea-level curve, the major volcanic events, the global climate, the major geodynamic events, and the ages of the five big extinctions of the Phaneroz(700 × 936 (78 KB)) - 20:46, 16 February 2016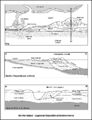
File:M91FG192.JPG Generalized map and cross sections showing major environments and facies associations of a barrier island-lagoonal system (f(800 × 1,042 (140 KB)) - 21:15, 12 August 2015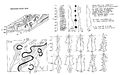
File:M31F4.jpg Summary diagram illustrating the major characteristics of meandering point-bar deposits. From Deltaic environments(1,464 × 916 (326 KB)) - 19:19, 15 August 2014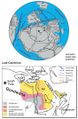
File:M106Ch01Fig02.jpg ...as evidenced by facies distribution across these regions. The position of major Late Precambrian–Cambrian faults and rift zones (inactive at the time of(700 × 1,068 (123 KB)) - 21:46, 17 February 2016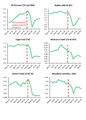
File:Figure2 2019-20 Comm Rept.jpg Status of major U.S. tight oil plays. Data source: U.S. EIA, U.S. Tight oil production repo(1,500 × 2,100 (517 KB)) - 18:57, 5 April 2021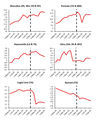
File:Figure3 2019-20 Comm Rept.jpg Status of major U.S. tight gas plays. Data source: U.S. EIA, U.S. Tight gas production repo(1,500 × 1,875 (495 KB)) - 19:34, 5 April 2021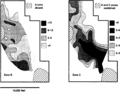
File:Subsurface-maps fig6.png ...eld, Ector and Crane Counties, Texas. Contours in PV fraction-feet. (After Major and Holtz, 1989.)(1,944 × 1,484 (237 KB)) - 20:42, 14 January 2014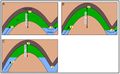
File:GumelarFigure8.jpg a) & b) are examples of leaks from a major structure. HCH in a) has a lower height than b). c) has a spill point value(870 × 540 (75 KB)) - 20:33, 28 October 2021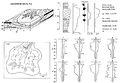
File:M31F6.jpg Summary diagram illustrating the major characteristics of lacustrine delta-fill deposits in the upper delta plain.(1,467 × 1,013 (318 KB)) - 19:40, 15 August 2014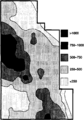
File:Subsurface-maps fig7.png ...field, Ector and Crane counties, Texas. Contours in MSTB/year/acre. (After Major and Holtz, 1989.)(944 × 1,353 (62 KB)) - 20:42, 14 January 2014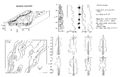
File:M31F3.jpg Summary diagrams illustrating the major characteristics of braided channel deposits (letters on the vertical sectio(2,941 × 1,884 (830 KB)) - 19:02, 15 August 2014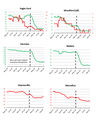
File:Figure4 2019-20 Comm Rept.jpg Status of major U.S. tight oil & gas plays: Rig counts over the last 12 months according to(1,500 × 1,875 (423 KB)) - 19:44, 5 April 2021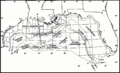
File:1024px-Northern Gulf of Mexico map.png Map of northern part of Gulf of Mexico. Major physiogeographic features of the northern part of Gulf of Mexico outer cont(1,024 × 622 (421 KB)) - 17:22, 23 December 2014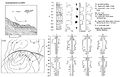
File:M31F26.jpg Summary diagram illustrating the major characteristics of slump deposits in the subaqueous delta plain. Coleman, J(1,499 × 968 (531 KB)) - 18:22, 18 August 2014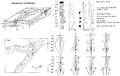
File:M31F13.jpg Summary diagram illustrating the major characteristics of the abandoned distributary deposits in the lower delta p(1,508 × 950 (293 KB)) - 15:16, 18 August 2014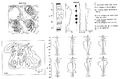
File:M31F9.jpg Summary diagram illustrating the major characteristics of the bay-fill deposits in the lower delta plain. Coleman,(1,510 × 990 (305 KB)) - 15:13, 18 August 2014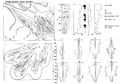
File:M31F22.jpg Summary diagram illustrating the major characteristics of river-mouth tidal ridge deposits in the subaqueous delta(1,416 × 989 (554 KB)) - 18:20, 18 August 2014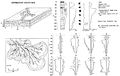
File:M31F17.jpg Summary diagram illustrating the major characteristics of the distributary-mouth bar deposits in the subaqueous de(1,519 × 957 (150 KB)) - 18:17, 18 August 2014


