Search results
Jump to navigation
Jump to search
- text = re.sub(r"(<br>)*(\n)*\n-- ",r"\n* ",text) text = re.sub(r"\n\n\*",r"\n*",text) # to handle double newlines5 KB (792 words) - 16:09, 1 October 2013
- ...eservoir or in the laboratory by addition of excess n-pentane, n-exane, or n-heptane. After precipitation of asphaltenes, the remaining oil consists of886 bytes (126 words) - 16:34, 25 June 2015
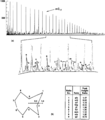
File:Oil-and-condensate-analysis fig5.png ...phic trace for peaks between <italic>n</italic>-C<sub>17</sub> and <italic>n</italic>-C<sub>25</sub>.(1,942 × 2,226 (120 KB)) - 17:17, 14 January 2014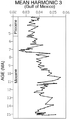
File:Applied-paleontology fig17-33.png Printed with permission of N. Healy-Williams, University of South Carolina.(769 × 1,312 (208 KB)) - 16:08, 18 January 2014- ...data/specpubs/beaumont/ch02/ch02.htm What is a trap?], in E. A. Beaumont & N. H. Foster, eds., [http://store.aapg.org/detail.aspx?id=545 Exploring for O ...Predicting reservoir system quality and performance], in E. A. Beaumont & N. H. Foster, eds., [http://store.aapg.org/detail.aspx?id=545 Exploring for O1 KB (206 words) - 17:37, 27 January 2015
- ...t/ch02/ch02.htm Classification of exploration traps] in E. A. Beaumont and N. H. Foster, eds., Handbook of Petroleum Geology: Exploring for Oil and Gas951 bytes (136 words) - 20:39, 10 February 2015
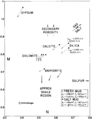
File:Difficult-lithologies fig1.png M-N crossplot for mineral identification. Copyright: Schlumberger Well Services(950 × 1,231 (43 KB)) - 01:11, 14 January 2014- ==Lists'n'things==1 KB (211 words) - 20:59, 5 December 2013
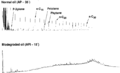
File:Oil-and-condensate-analysis fig2.png ...35° API gravity oil and a biodegraded oil showing the lose of aliphatics (n-paraffins and isoprenoids) due to biodegradation.(1,924 × 1,166 (19 KB)) - 17:17, 14 January 2014- ...rstandingearth5e/content/cat_120/08120-01.htm?v=chapter&i=08120.01&s=08000&n=00120&o=|11000| Animation. with a sample seismic line]449 bytes (57 words) - 18:48, 28 August 2014
File:McCully shale New Brunswick rig.jpg ...at the Nabors Drilling Rig #58 drilling the Corridor/PCS McCully O-67-2425/N-66 well in New Brunswick. Photo Courtesy of: New Brunswick Department of Na(300 × 199 (30 KB)) - 16:17, 15 January 2014- ...rstandingearth5e/content/cat_120/08120-01.htm?v=chapter&i=08120.01&s=08000&n=00120&o=|11000| Animation. with a sample seismic line]480 bytes (61 words) - 16:30, 28 August 2014
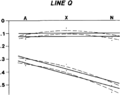
File:Mapping-with-two-dimensional-seismic-data fig1.png ...misties are averaged. Dots show times of events on seismic lines A, X, and N where those lines intersect line Q. Solid lines show true attitude of beds.(945 × 749 (19 KB)) - 19:36, 14 January 2014- {{fossil range/bar|Neogene|<small>N</small>}}1 KB (135 words) - 14:19, 5 November 2013
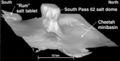
File:Mth14ch04f04.jpg ...outh Pass 62 Salt-dome Field, by E. P. Mason, M. J. Bastian, R. Detomo, M. N. Hashem, and A. J. Hildebrandt, Pages 49 - 65, in AAPG Methods in Explorati(400 × 202 (17 KB)) - 16:51, 7 December 2015
File:Mth14ch04f03.jpg ...outh Pass 62 Salt-dome Field, by E. P. Mason, M. J. Bastian, R. Detomo, M. N. Hashem, and A. J. Hildebrandt, Pages 49 - 65, in AAPG Methods in Explorati(500 × 495 (47 KB)) - 16:09, 7 December 2015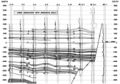
File:Mth14ch04f06.jpg ...outh Pass 62 Salt-dome Field, by E. P. Mason, M. J. Bastian, R. Detomo, M. N. Hashem, and A. J. Hildebrandt, Pages 49 - 65, in AAPG Methods in Explorati(800 × 563 (141 KB)) - 16:55, 7 December 2015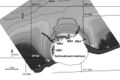
File:Mth14ch04f05.jpg ...outh Pass 62 Salt-dome Field, by E. P. Mason, M. J. Bastian, R. Detomo, M. N. Hashem, and A. J. Hildebrandt, Pages 49 - 65, in AAPG Methods in Explorati(700 × 469 (63 KB)) - 16:53, 7 December 2015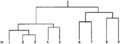
File:Multivariate-data-analysis fig2.png Dendrogram (by aggregation). Starting from <italic>n</italic> samples, combine the two most similar samples (here 2 and 3). Then(949 × 348 (7 KB)) - 00:51, 14 January 2014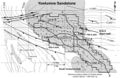
File:Mth14ch02f01.jpg Structure map of Yowlumne field drawn on the N-point marker, a regional correlation horizon that marks the approximate top(700 × 457 (103 KB)) - 23:18, 3 December 2015


