Search results
Jump to navigation
Jump to search
File:Log-analysis-applications fig5.png ...on water resistivity) and relates water saturation (<italic>S</italic><sub>w</sub>) to porosity and true resistivity.(929 × 801 (40 KB)) - 16:36, 14 January 2014
File:Sem-xrd-cl-and-xf-methods fig5.png {{copyright|W. J. Myers}} ...bright bands and higher Fe<sup>+2</sup> dolomite as dark bands. Copyright: W. J. Myers.(1,004 × 725 (583 KB)) - 22:29, 14 January 2014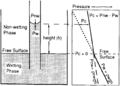
File:Capillary-pressure fig2.png ...different densities of the nonwetting (ρ<sub>nw</sub>) and wetting (ρ<sub>w</sub>) phases (right).(947 × 675 (25 KB)) - 18:22, 14 January 2014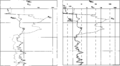
File:Determination-of-water-resistivity fig4.png Example problem showing determination of ''R''<sub>w</sub> from resistivity ratio.(1,955 × 1,079 (24 KB)) - 19:18, 14 January 2014- mw.loader.load( '//commons.wikimedia.org/w/index.php?title=MediaWiki:Gadget-HotCat.js&action=raw&ctype=text/javascript149 bytes (22 words) - 18:24, 17 January 2014
- ...ion?|Archie equation]] is the most widely used method of determining S<sub>w</sub>. ...th>\text{Hydrocarbon saturation } (\text{S}_\text{h}) = 1 - \text{S}_\text{w}</math>2 KB (227 words) - 13:38, 5 April 2022
- :<math>\rho_{\rm w} \mbox{gH}_{\rm w} - \rho_{\rm h}\mbox{gH}_{\rm h}</math> * ρ<sub>w</sub> = water density4 KB (582 words) - 22:08, 17 February 2022
- ...ize distribution]], and [[Reservoir quality|pore geometry]]. Mapping S<sub>w</sub> distribution in a reservoir helps us predict trap boundaries. ...}}Hypothetical example of an S<sub>w</sub>–depth plot with estimated S<sub>w</sub> distribution curves for several flow units for a hydrocarbon-bearing5 KB (687 words) - 17:09, 5 April 2022
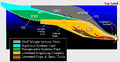
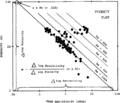
File:Systems Tracts.jpg ...l et al. (1987). From Seismic Stratigraphy-A Primer on Methodology by John W. Snedden and J. F. (Rick) Sarg, Search and Discovey Article #40270 (2008).(750 × 386 (174 KB)) - 20:29, 21 July 2014- ....</ref> and therefore is a powerful graphic technique for estimating S<sub>w</sub> ranges within a reservoir. All that is needed to make a Pickett plot # Plot R<sub>w</sub> point on the R<sub>t</sub> scale.6 KB (878 words) - 16:16, 5 April 2022
- ...n the formula below can be used to estimate formation water density (ρ<sub>w</sub>):<ref name=ch05r4>Collins, A., G., 1987, Properties of produced water :<math>\rho_{\rm w} = 1 + \mbox{TDS} \times 0.695 \times 10^{-6} \mbox{ g/cm}^{3}</math>5 KB (714 words) - 15:19, 13 September 2022
- ==Log response and S<sub>w</sub>== ...have the expected effect on log responses and [[water saturation]]s (S<sub>w</sub>). The Midale vuggy beds in a cored field well consist of interbeds of4 KB (588 words) - 17:01, 12 April 2022
- :<math>(\rho_{\rm w} - \rho_{\rm h}) \mbox{g} h = \frac{2\gamma \cos \theta}R</math> ...\frac{\left(\displaystyle\frac{2\gamma \cos \theta} R \right)}{(\rho_{\rm w} - \rho_{\rm h})\mbox{g}}</math>3 KB (488 words) - 16:13, 31 March 2022
- #*<math>\text{H}_{\text{w}} = \text{Z} + \left( \frac{\text{P}} {\text{grad P}} \right)</math> ...left(\frac{\rho_{\rm w}}{\rho_{\rm w} - \rho_{\rm hc}}\right)\mbox{H}_{\rm w}</math>4 KB (601 words) - 22:27, 17 February 2022
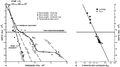
File:BasinCenteredGasFig7.jpg ...). Location of well shown on Figure 3. Pressure gradient interpreted by C. W. Spencer. From Law, Ben E., 2002, Basin-centered gas systems: AAPG Bulletin(700 × 392 (40 KB)) - 18:58, 14 January 2015- ...s in calculating [[water saturation]] using the [[Archie equation]]. R<sub>w</sub> can be measured from a sample of formation water taken from the zone To calculate R<sub>w</sub> from SP, we need the following data:6 KB (1,027 words) - 16:40, 5 April 2022
- ...complex '''non-Archie porosity'''. In most cases, water saturation (S<sub>w</sub>) of rocks with Archie porosity can be predicted from log analysis usi ...\mbox{S}_{\rm w} = \left(\frac{1}{\Phi^{\rm m}} \times \frac{\mbox{R}_{\rm w}}{\mbox{R}_{\rm t}}\right)^{\rm 1/n}</math>4 KB (528 words) - 13:53, 4 April 2022
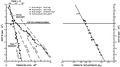
File:BasinCenteredGasFig8.jpg ...). Location of well shown on Figure 3. Pressure gradient interpreted by C. W. Spencer. From Law, Ben E., 2002, Basin-centered gas systems: AAPG Bulletin(700 × 389 (41 KB)) - 19:13, 14 January 2015- :<math>w = \frac{R g D^2}{C_1 \nu + \sqrt{0.75\,C_2\, R g D^3}}</math> :<math>w = \frac{R g D^2}{C_1 \nu + \sqrt{0.75\,C_2\, R g D^3}}</math>1 KB (207 words) - 16:45, 9 October 2013
- ...eservoir system by definition contains water as a single phase (100% S<sub>w</sub>). The [[permeability]] of that rock to water is absolute permeability ...ub> of the rock. In other words, as [[buoyancy pressure]] increases, S<sub>w</sub> decreases and the effective size of the pore throat for oil or gas fl9 KB (1,351 words) - 13:31, 5 April 2022


