Search results
Jump to navigation
Jump to search
Page title matches
- ...lume actually trapped. This “calibration factor” then is used routinely in yield estimates. ...ocarbons generated in the source [[kitchen]], then calibration factors and yield estimates can be extremely misleading. In addition, hydrocarbons may spill2 KB (316 words) - 18:20, 29 March 2022
- #REDIRECT [[Seal and hydrocarbon yield estimates]]50 bytes (6 words) - 20:18, 19 December 2014
Page text matches
- #REDIRECT [[Seal and hydrocarbon yield estimates]]50 bytes (6 words) - 20:18, 19 December 2014
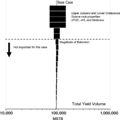
File:H4CH12FG7.JPG ...ic and Lower Cretaceous source rocks have the most effect on the total oil yield. oTOC and oHI are the original source rock total organic carbon and hydroge(600 × 599 (51 KB)) - 21:12, 9 July 2015- ...lume actually trapped. This “calibration factor” then is used routinely in yield estimates. ...ocarbons generated in the source [[kitchen]], then calibration factors and yield estimates can be extremely misleading. In addition, hydrocarbons may spill2 KB (316 words) - 18:20, 29 March 2022
- ==Implications for yield predictions== ...uating-source-rocks_fig6-19.png|300px|thumb|{{figure number|1}}Examples of yield curves for the same well, based on both open- and closed-system modeling co3 KB (398 words) - 15:15, 14 February 2022
- ...e, yesterday's dry hole may be revived (or a twin to it may be drilled) to yield today's successful well.322 bytes (52 words) - 13:44, 18 March 2019
File:H4CH12FG12.JPG Exceedence probability curves for the oil yield over the last 15 m.y. for a selected drainage polygon for the two cases sho(600 × 346 (51 KB)) - 21:41, 13 July 2015File:H4CH12FG13.JPG A probability map of net yield greater than 1 million stock tank barrels (MSTB)/km2. Map has the same area(600 × 480 (128 KB)) - 21:42, 13 July 2015- | Potential ultimate yield || Lateral migration factor* | Yield fraction timing || Vertical migration factor*6 KB (834 words) - 20:41, 14 February 2022
File:H4CH12FG9.JPG Yield timing for minimum, base, and maximum extension cases for the hypothetical(800 × 262 (80 KB)) - 20:34, 13 July 2015- ==Hydrocarbon generation—depth and yield== The depth of [[Petroleum generation|hydrocarbon generation]] and the yield of individual [[hydrocarbon]] phases are primarily a function of the [[kine5 KB (651 words) - 16:11, 10 February 2022
- ...types of [[kerogen]]s convert to hydrocarbons at different rates, and they yield different quantities of various [[hydrocarbon phase]]s. Therefore, one stan2 KB (220 words) - 16:10, 10 February 2022
- ...orth Sea also yield moderately high-sulfur oils, most clastic source rocks yield oils with less than 0.5% sulfur by weight. However, sulfur content is also4 KB (571 words) - 17:34, 15 February 2022
- * [[Effect of seal on hydrocarbon yield estimates]]2 KB (261 words) - 18:12, 29 March 2022
- * [[Effect of seal on hydrocarbon yield estimates]]3 KB (405 words) - 18:19, 29 March 2022
- ...Mature [[source rock]]s occurring between the deeply rooted diapirs could yield hydrocarbons able to migrate within each salt-walled compartment of each de ...27–139.</ref> Maturing source rocks of Mesozoic and early Tertiary age can yield hydrocarbons that may migrate vertically along growth faults and salt walls7 KB (970 words) - 20:33, 18 February 2022
- ...the United States, where better information is available, the average NGL yield of natural gas is higher: 35-40 bbl per mmcf. The ratio, of course, varies4 KB (549 words) - 16:31, 25 June 2015
- ...generation stage for a calibrated well based on the depth vs. hydrocarbon yield plot (left figure). For example, the onset of oil generation occurs at appr4 KB (503 words) - 14:18, 14 February 2022
- ...ic and Lower Cretaceous source rocks have the most effect on the total oil yield. oTOC and oHI are the original source rock total organic carbon and hydroge ...]]). The yields are plotted on a log scale to more clearly examine the low-yield (high-risk) cases. Analysis of this plot provides a good opportunity to thi38 KB (5,890 words) - 15:16, 23 August 2016
- ...of a planet with [[plate tectonics]] has driving forces that exceed the [[yield strength]] of the brittle lithosphere, causing the lithosphere to [[fractur ...id regime occurs when mantle driving forces do not exceed the lithospheric yield strength, resulting in a single, continuous rigid plate overlying the mantl19 KB (2,736 words) - 12:59, 14 March 2019
- | S3 mg Co2/g rock || The CO<sub>2</sub> yield during thermal breakdown of kerogen || Most prevalent in calcareous source4 KB (573 words) - 18:22, 8 February 2022


