Search results
Jump to navigation
Jump to search
Page title matches
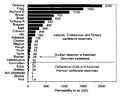
File:Average permeability.jpg (405 × 324 (44 KB)) - 15:34, 30 June 2015
File:Average permeability-Gluyas.jpg (405 × 324 (44 KB)) - 15:34, 30 June 2015


Page text matches
File:Evaluating-tight-gas-reservoirs fig3.png Histograms showing (a) average porosity values and (b) average permeability values for cored tight gas reservoir facies. (From Moslow and(1,964 × 879 (37 KB)) - 18:47, 14 January 2014
File:Using-and-improving-surface-models-built-by-computer fig3.png ...polated values for a weighted average algorithm tend to “come back” to the average of near data values. (b) Acceptable surface extrapolation achieved by creat(924 × 438 (5 KB)) - 22:32, 13 January 2014
File:Conducting-a-reservoir-simulation-study-an-overview fig5.png ...lculated for series flow (geometric average) and parallel flow (arithmetic average). Copyright: Lishman, 1970</xref>; Courtesy Canadian Institute of Mining, M(854 × 1,328 (69 KB)) - 18:46, 14 January 2014
File:Figure1.png Figure 1. Hydrologic cycle with global annual average water balance(535 × 380 (237 KB)) - 08:32, 29 June 2015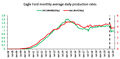
File:Figure3EagleFord2019-20CommRept.jpg Average monthly daily production rates for crude oil from the Eagle Ford (U.S. EIA,(468 × 230 (67 KB)) - 21:55, 6 April 2021
File:Subsurface-maps fig5.png Porosity-weighted average water saturation map for Layer 2 of a Middle Eastern carbonate reservoir.(889 × 1,444 (71 KB)) - 20:42, 14 January 2014
File:Using-and-improving-surface-models-built-by-computer fig22.png ...hydrocarbon rock thickness is progressively reduced by net to gross ratio, average porosity, and oil saturation, until only the thickness of pores filled with(938 × 308 (15 KB)) - 22:33, 13 January 2014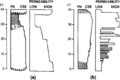
File:Geological-heterogeneities fig2.png ...ng- or thickening-upward sequences. ''Fining'' and ''coarsening'' refer to average relative grain size of individual laminae and beds, and ''thinning'' and ''(940 × 630 (40 KB)) - 15:35, 14 January 2014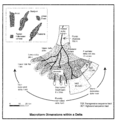
File:M91FG123.png A schematic delta showing a range of sand body types at their average dimensions, together with several oil and gas fields at the same scale. The(2,064 × 2,095 (121 KB)) - 19:40, 13 August 2015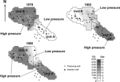
File:Mth14ch02f06.jpg Maps showing fieldwide variations in the average reservoir pressure of the Yowlumne Sandstone. The variations indicate that(700 × 481 (51 KB)) - 17:48, 4 December 2015


