Search results
Jump to navigation
Jump to search
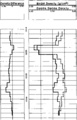
File:Borehole-gravity fig1.png ...een 6330 and 6370 ft is caused by porosity not detected by the gamma-gamma density log. The broader difference anomaly observed over the length of the logged(933 × 1,451 (17 KB)) - 15:41, 14 January 2014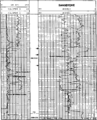
File:Standard-interpretation fig4.png Density-neutron log for example interpretation.(950 × 1,179 (45 KB)) - 20:29, 14 January 2014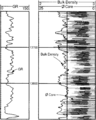
File:Core-log-transformations-and-porosity-permeability-relationships fig2.png Plot showing shitted core porosity, together with bulk density log.(931 × 1,163 (74 KB)) - 18:05, 14 January 2014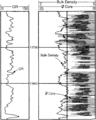
File:Core-log-transformations-and-porosity-permeability-relationships fig1.png Plot showing unshifted core porosity in spiked format, together with bulk density log.(938 × 1,169 (73 KB)) - 18:05, 14 January 2014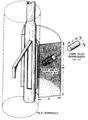
File:Core-log-transformations-and-porosity-permeability-relationships fig3.png Comparison of the volume of formation measured by the bulk density tool relative to that obtained from a core plug.(893 × 1,221 (82 KB)) - 18:05, 14 January 2014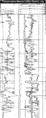
File:Basic-open-hole-tools fig2.png A typical log showing density, compensated neutron, Pe, gamma ray, and caliper measurements. Copyright: S(944 × 2,424 (71 KB)) - 18:21, 13 January 2014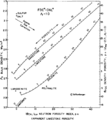
File:Standard-interpretation fig2.png Density-neutron crossplot chart. Copyright: Schlumberger Well Services, 1979.(941 × 1,052 (59 KB)) - 20:29, 14 January 2014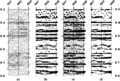
File:Displaying-seismic-data fig1.png ...trace, (b) variable area, (c) variable area wiggle trace, and (d) variable density. Copyright: Conoco Inc.(1,959 × 1,316 (101 KB)) - 01:20, 14 January 2014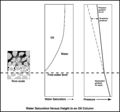
File:Mem91BuoyancyForcesFig26.jpg ...the oil-water interface and the force of gravity acting together with the density contrast between the reservoir fluids, tending to pull the water down.(600 × 559 (38 KB)) - 17:36, 7 April 2014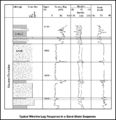
File:M91Ch6FG43.JPG Gamma-ray, density, neutron, and sonic log response of a sandstone and shale sequence. This ex(800 × 827 (107 KB)) - 17:07, 3 June 2015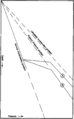
File:Pressure-detection fig2.png ...of pressure above normal follows the aquathermal gradient (constant water density) and then follows the fracture gradient. (After Barker and Horsfeld, 1982.)(942 × 1,519 (43 KB)) - 18:23, 14 January 2014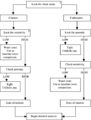
File:Mth16Ch7Figure7-1.jpg Using this scanning technique in combination with the neutron-density quick-look technique discussed in Chapter 4 of Basic Well Log Analysis, 2nd(400 × 528 (39 KB)) - 16:08, 21 May 2014


