Search results
Jump to navigation
Jump to search
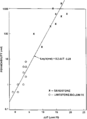
File:Full-waveform-acoustic-logging fig3.png Plot of the difference between the measured slowness and the predicted elastic slowness (ΔΔT) against the core-measured permeability values for both the(948 × 1,299 (12 KB)) - 14:23, 29 August 2014
