Search results
Jump to navigation
Jump to search
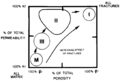
File:Evaluating-fractured-reservoirs fig1.png ...talic><sub><italic>f</italic></sub> = fracture permeability, ϕ<sub><italic>f</italic></sub>= fracture porosity, <italic>k</italic><sub><italic>r</italic(942 × 642 (23 KB)) - 15:00, 14 January 2014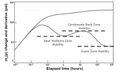
File:AlAhmadiTawfiqFigure6.jpg ...nse of Gas Condensate Well Producing Below the Dew Point (Halim, A., Nuri, F., & Adi P, S. 2015).(737 × 474 (37 KB)) - 23:06, 9 November 2021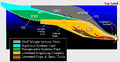
File:Systems Tracts.jpg ...rom Seismic Stratigraphy-A Primer on Methodology by John W. Snedden and J. F. (Rick) Sarg, Search and Discovey Article #40270 (2008).(750 × 386 (174 KB)) - 20:29, 21 July 2014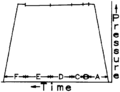
File:Drill-stem-testing fig7.png ...eriod; (C) initial buildup; (D) final flow period; (E) final buildup; and (F) pulling out of hole.(728 × 559 (6 KB)) - 22:25, 14 January 2014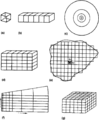
File:Conducting-a-reservoir-simulation-study-an-overview fig1.png ...al radial. (d) Two-dimensional cross-sectional. (e) Two-dimensional area. (f) Two-dimensional radial. (g) Three-dimensional. (From Mattax and Dalton, 19(922 × 1,118 (50 KB)) - 18:46, 14 January 2014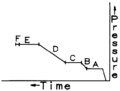
File:Drill-stem-testing fig3.png ...tial shut-in period; (D) final flow period; (E) final shut-in period; and (F) pulling out of hole.(748 × 570 (5 KB)) - 22:25, 14 January 2014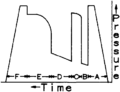
File:Drill-stem-testing fig6.png ...eriod; (C) initial buildup; (D) final flow period; (E) final buildup; and (F) release packer and pulling out of hole.(724 × 556 (6 KB)) - 22:25, 14 January 2014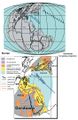
File:M106Ch01Fig07.jpg ...thern margin of the Tethys (below) during Norian time (about 205 Ma). From F. Berra and L. Angiolini, 2014, The evolution of the Tethys region throughou(700 × 1,073 (131 KB)) - 20:18, 18 February 2016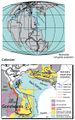
File:M106Ch01Fig08.jpg ...rn margin of the Tethys (below) during Callovian time (about 164 Ma). From F. Berra and L. Angiolini, 2014, The evolution of the Tethys region throughou(700 × 1,118 (150 KB)) - 20:24, 18 February 2016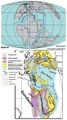
File:M106Ch01Fig09.jpg ...thern margin of the Tethys (below) during Aptian time (about 120 Ma). From F. Berra and L. Angiolini, 2014, The evolution of the Tethys region throughou(652 × 1,170 (158 KB)) - 20:27, 18 February 2016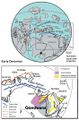
File:M106Ch01Fig04.jpg ...rgin of the Tethys (below) during Early Devonian time (about 400 Ma). From F. Berra and L. Angiolini, 2014, The evolution of the Tethys region throughou(700 × 1,066 (133 KB)) - 22:45, 17 February 2016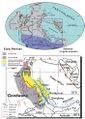
File:M106Ch01Fig05.jpg ...argin of the Tethys (below) during Early Permian time (about 290 Ma). From F. Berra and L. Angiolini, 2014, The evolution of the Tethys region throughou(700 × 984 (131 KB)) - 23:07, 17 February 2016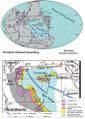
File:M106Ch01Fig06.jpg ...(below) at the time of the Permian-Triassic boundary (about 251 Ma). From F. Berra and L. Angiolini, 2014, The evolution of the Tethys region throughou(700 × 981 (132 KB)) - 20:15, 18 February 2016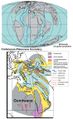
File:M106Ch01Fig10.jpg ...ow) at the time of the Cretaceous-Paleocene boundary (about 65.5 Ma). From F. Berra and L. Angiolini, 2014, The evolution of the Tethys region throughou(700 × 1,144 (154 KB)) - 20:35, 18 February 2016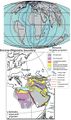
File:M106Ch01Fig11.jpg ...s (below) at the time of the Eocene-Oligocene boundary (about 34 Ma). From F. Berra and L. Angiolini, 2014, The evolution of the Tethys region throughou(691 × 1,168 (169 KB)) - 20:37, 18 February 2016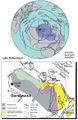
File:M106Ch01Fig03.jpg ...ovician time (about 440 Ma), modified after Cocks and Torsvik (2002). From F. Berra and L. Angiolini, 2014, The evolution of the Tethys region throughou(700 × 1,076 (124 KB)) - 22:21, 17 February 2016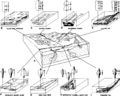
File:Lithofacies-and-environmental-analysis-of-clastic-depositional-systems fig3.png ...pected in such a sequence. (Parts c and d are from Walker, 1984, and parts f, h, and i are from Galloway and Hobday, 1983.)(1,950 × 1,563 (201 KB)) - 21:37, 13 January 2014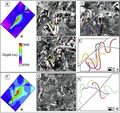
File:AlHawajAlQahtaniFigure6.jpg ...oration using the channels geometry to constrain strike-slip displacement. F) Faulted horizon surface. The small black box is the location of G & H. G)(468 × 439 (80 KB)) - 21:05, 8 November 2021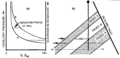
File:Fluid-contacts fig4.png ...orresponding to capillary pressure curves. The free water surface (<italic>f</italic><sub>w</sub>) is the same for all facies, but the different displac(1,924 × 933 (108 KB)) - 01:52, 14 January 2014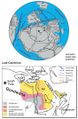
File:M106Ch01Fig02.jpg ...), where salt deposition occurred, is indicated by the dashed faults. From F. Berra and L. Angiolini, 2014, The evolution of the Tethys region throughou(700 × 1,068 (123 KB)) - 21:46, 17 February 2016


