Search results
Jump to navigation
Jump to search
Page title matches
File:Evaluating-stratigraphically-complex-fields fig1.png (1,535 × 1,621 (139 KB)) - 22:02, 13 January 2014

Page text matches
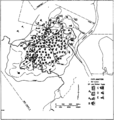
File:M114CH01FG01.jpg ...II show the two areas selected for a 2-D basin modeling study. The Unayzah fields contain oil sourced by Qusaiba shales. From AAPG Memoir 114: Petroleum Syst(685 × 692 (98 KB)) - 16:39, 28 December 2018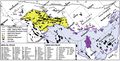
File:M106Ch14Fig02.jpg ...L. Bordenave, 2014, Petroleum Systems and Distribution of the Oil and Gas Fields in the Iranian Part of the Tethyan Region, in L. Marlow, C. Kendall, and L.(700 × 357 (77 KB)) - 18:08, 12 July 2016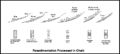
File:M91FG200.JPG Redeposited chalk provides the main reservoir intervals in chalk fields. Resedimentation processes include sliding, slumping, debris flows, turbidi(800 × 360 (48 KB)) - 13:12, 20 August 2015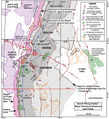
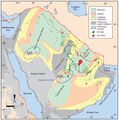
File:M115CH02FG03.jpg ...solid fill. Fields with Cenozoic reservoirs are shown with black outlines; fields and discoveries with Middle Jurassic and older reservoirs are shown with or(700 × 767 (157 KB)) - 21:29, 10 January 2019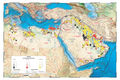
File:M106IntroFig01.jpg Basins, fields, and structures data from IHS International Energy Database (January 2010).(1,932 × 1,288 (1.62 MB)) - 18:25, 18 February 2016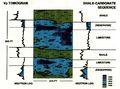
File:Cross-borehole-tomography-in-development-geology fig4.jpg ...ast in log curves and the corresponding change in the tomographic velocity fields. (After Justice et al., 1990.). See [[Cross-borehole tomography in developm(1,945 × 1,441 (1.35 MB)) - 17:12, 15 January 2014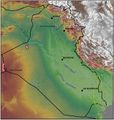
File:M106Ch12Fig01.jpg ...map of Iraq, showing major cities and rivers, along with major oil and gas fields. Points of high elevation are indicated. From Grabowski Jr., G. J., 2014, I(700 × 735 (96 KB)) - 20:15, 11 May 2016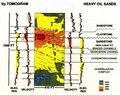
File:Cross-borehole-tomography-in-development-geology fig5.jpg ...aphic units and fluid saturation zones correlate with tomographic velocity fields and provide the basis for interpretation of reservoir and fluid properties.(2,000 × 1,591 (1.16 MB)) - 17:12, 15 January 2014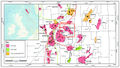
File:M115CH10FG01.jpg ...ield in UKCS Blocks 16/8a and 16/8d showing the nearby producing Brae area fields and discoveries within the South Viking Graben. From AAPG Memoir 115—Rift(1,279 × 723 (781 KB)) - 18:33, 17 January 2019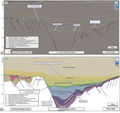
File:M115CH02FG05.jpg ...c section across the South Viking Graben, through the East Brae and Gudrun fields. Location shown on [[South Viking Graben|Figures 1, 2, 3]]. Courtesy of PGS(2,917 × 2,758 (906 KB)) - 21:50, 10 January 2019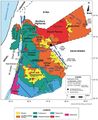
File:M106Ch07Fig1.jpg ...imentary basins, structural elements, key petroleum wells, and hydrocarbon fields in Jordan. Modified after Beydoun et al. (1994) and NRA (2001). 100 km (62.(700 × 857 (97 KB)) - 20:28, 18 April 2016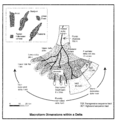
File:M91FG123.png ...body types at their average dimensions, together with several oil and gas fields at the same scale. The delta front is divided into three segments that are(2,064 × 2,095 (121 KB)) - 19:40, 13 August 2015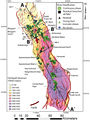
File:M114CH03FG02.jpg ...ructure map constructed on top of the Fatehgarh Formation showing the main fields and important wells in the Barmer Basin together with the regional distribu(700 × 930 (155 KB)) - 17:48, 4 January 2019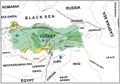
File:M106Ch13Fig02.jpg ...roleum fields are marked as green and gas fields are marked as yellow. Oil fields are numbered in Thrace and SE Turkey. For SE Turkey: 1. B. Firat, 2. B. Kay(700 × 491 (61 KB)) - 19:34, 5 July 2016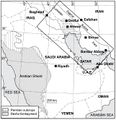
File:M106Ch14Fig01.jpg ...L. Bordenave, 2014, Petroleum Systems and Distribution of the Oil and Gas Fields in the Iranian Part of the Tethyan Region, in L. Marlow, C. Kendall, and L.(641 × 662 (94 KB)) - 18:05, 12 July 2016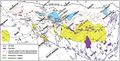
File:M106Ch14Fig12.jpg ...L. Bordenave, 2014, Petroleum Systems and Distribution of the Oil and Gas Fields in the Iranian Part of the Tethyan Region, in L. Marlow, C. Kendall, and L.(700 × 356 (74 KB)) - 19:40, 12 July 2016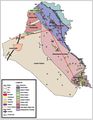
File:M106Ch12Fig03.jpg Map of tectonic provinces of Iraq, showing major structural features. Fields and significant wells with oil and/or gas shows are shown; numbers refer to(700 × 902 (78 KB)) - 13:57, 12 May 2016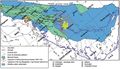
File:M106Ch14Fig14.jpg ...L. Bordenave, 2014, Petroleum Systems and Distribution of the Oil and Gas Fields in the Iranian Part of the Tethyan Region, in L. Marlow, C. Kendall, and L.(700 × 402 (73 KB)) - 19:35, 12 July 2016
File:M106Ch14Fig07.jpg ...L. Bordenave, 2014, Petroleum Systems and Distribution of the Oil and Gas Fields in the Iranian Part of the Tethyan Region, in L. Marlow, C. Kendall, and L.(700 × 567 (117 KB)) - 18:19, 12 July 2016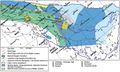
File:M106Ch14Fig11.jpg ...L. Bordenave, 2014, Petroleum Systems and Distribution of the Oil and Gas Fields in the Iranian Part of the Tethyan Region, in L. Marlow, C. Kendall, and L.(700 × 422 (79 KB)) - 18:36, 12 July 2016


