Search results
Jump to navigation
Jump to search
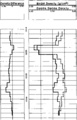
File:Borehole-gravity fig1.png ...y between 6330 and 6370 ft is caused by porosity not detected by the gamma-gamma density log. The broader difference anomaly observed over the length of the(933 × 1,451 (17 KB)) - 15:41, 14 January 2014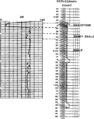
File:Rate-of-penetration fig2.png Example of correlating ROP with gamma ray curves.(954 × 1,212 (89 KB)) - 17:58, 14 January 2014
File:M106Ch07Fig04.jpg ...alues of greater than 1–2%, depending on the degree of thermal maturation. Gamma-ray values in some wells have been adjusted according to offset shale basel(564 × 855 (75 KB)) - 20:49, 18 April 2016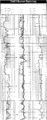
File:Basic-open-hole-tools fig1.png A typical log showing SP, gamma ray, dual Induction, and sonic measurements. Copyright: Schlumberger, 1983.(948 × 2,429 (78 KB)) - 18:21, 13 January 2014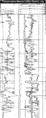
File:Basic-open-hole-tools fig2.png A typical log showing density, compensated neutron, Pe, gamma ray, and caliper measurements. Copyright: Schlumberger, 1983.(944 × 2,424 (71 KB)) - 18:21, 13 January 2014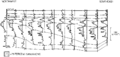
File:Lithofacies-and-environmental-analysis-of-clastic-depositional-systems fig2.png Gamma ray correlation (dip section) of a series of prograding shoreface sandstone(943 × 448 (16 KB)) - 21:36, 13 January 2014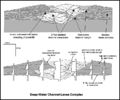
File:M91FG195.JPG ...hile (from Beaubouef, 2004). The lower section shows a series of idealized gamma ray logs. Reprinted with permission from the AAPG.(800 × 669 (93 KB)) - 15:36, 17 August 2015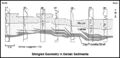
File:M91FG188.JPG ...ska (from Tye et al., 1999). Reprinted with permission from the AAPG. GR = gamma ray. From Shepherd, M., 2009, Deltaic reservoirs, in M. Shepherd, Oil field(800 × 385 (54 KB)) - 16:21, 20 August 2015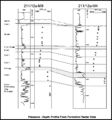
File:M91FG112.JPG ...et al., 1999). Reprinted with permission from the Geological Society. GR = Gamma Ray; RFTtrade = Repeat Formation Tester; UKCF = Upper Kimmeridge Clay Forma(800 × 856 (118 KB)) - 19:29, 18 August 2015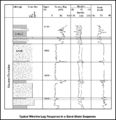
File:M91Ch6FG43.JPG Gamma-ray, density, neutron, and sonic log response of a sandstone and shale sequ(800 × 827 (107 KB)) - 17:07, 3 June 2015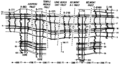
File:Geological-cross-sections fig2.png ...ake the cross section more compact. The left track of each log is an SP or gamma ray trace and the right track is a resistivity trace. (From Slatt et al., 1(1,921 × 1,041 (171 KB)) - 15:32, 14 January 2014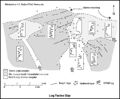
File:M91Ch11FG72.JPG ...rinted with permission from the AAPG. SP = spontaneous potential log; GR = gamma-ray log. Shepherd, M., 2009, Lithofacies maps, in M. Shepherd, Oil field pr(800 × 658 (69 KB)) - 15:51, 27 April 2015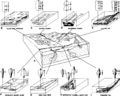
File:Lithofacies-and-environmental-analysis-of-clastic-depositional-systems fig3.png ...of major depositional environments. The curve on the left shows the SP or gamma ray response and the curve on the right shows the relative grain size profi(1,950 × 1,563 (201 KB)) - 21:37, 13 January 2014


