Search results
Jump to navigation
Jump to search
Page title matches
File:MainPageCore-log-transformations.png (600 × 600 (38 KB)) - 20:20, 13 July 2015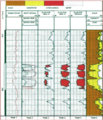
File:Log Analysis Fig-6.png (805 × 939 (1.17 MB)) - 17:45, 3 December 2014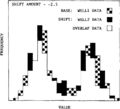
File:Log-analysis-applications fig7.png (925 × 838 (28 KB)) - 16:36, 14 January 2014
File:Well Log Analysis Fig-8.png (504 × 1,322 (62 KB)) - 14:38, 8 December 2014
File:Log Analysis Fig-7.png (819 × 535 (140 KB)) - 17:45, 3 December 2014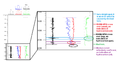
File:Well Log Analysis Fig-9A.png (1,516 × 786 (184 KB)) - 14:38, 8 December 2014
File:Well Log Analysis Fig-1.png (1,292 × 924 (103 KB)) - 14:26, 8 December 2014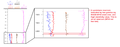
File:Well Log Analysis Fig-9B.png (1,506 × 596 (166 KB)) - 14:43, 8 December 2014
File:Well Log Analysis Fig-2.png (1,334 × 868 (76 KB)) - 14:26, 8 December 2014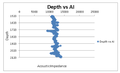
File:Well Log Analysis Fig-10A.png (1,162 × 710 (85 KB)) - 14:44, 8 December 2014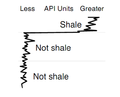
File:Well Log Analysis Fig-3.png (608 × 490 (60 KB)) - 14:27, 8 December 2014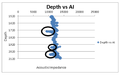
File:Well Log Analysis Fig-10B.png (1,140 × 712 (89 KB)) - 14:44, 8 December 2014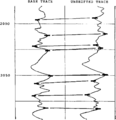
File:Log-analysis-applications fig1.png (936 × 971 (14 KB)) - 16:36, 14 January 2014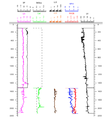
File:Well Log Analysis Fig-4A.png (1,240 × 1,336 (270 KB)) - 14:29, 8 December 2014
File:Well Log Analysis Fig-11.png (1,162 × 710 (75 KB)) - 14:45, 8 December 2014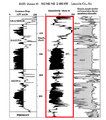
File:Log Analysis Fig-1.png (599 × 678 (159 KB)) - 17:53, 3 December 2014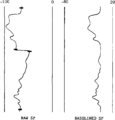
File:Log-analysis-applications fig2.png (939 × 983 (9 KB)) - 16:36, 14 January 2014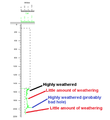
File:Well Log Analysis Fig-4B.png (1,212 × 1,326 (129 KB)) - 14:30, 8 December 2014
File:Log Analysis Fig-2.png (833 × 468 (342 KB)) - 17:44, 3 December 2014
File:Log-analysis-applications fig3.png (937 × 789 (19 KB)) - 16:36, 14 January 2014


Page text matches
File:AlAhmadiTawfiqFigure9.jpg Log-log plot of a well in two regions with varying mobility ratios (Houze, Viturat,(604 × 404 (55 KB)) - 23:21, 9 November 2021
File:Production-histories fig3.png Log-log production decline history.(927 × 695 (42 KB)) - 17:29, 14 January 2014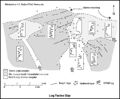
File:M91Ch11FG72.JPG ...h permission from the AAPG. SP = spontaneous potential log; GR = gamma-ray log. Shepherd, M., 2009, Lithofacies maps, in M. Shepherd, Oil field production(800 × 658 (69 KB)) - 15:51, 27 April 2015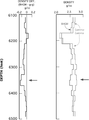
File:Applying-gravity-in-petroleum-exploration fig15-12.png {{copyright|Rasmussen, 1975; courtesy ''The Log Analyst''}} . Copyright: Rasmussen, 1975; courtesy ''The Log Analyst''.(1,198 × 1,621 (92 KB)) - 22:18, 17 January 2014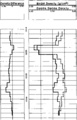
File:Borehole-gravity fig1.png ...and 6370 ft is caused by porosity not detected by the gamma-gamma density log. The broader difference anomaly observed over the length of the logged inte(933 × 1,451 (17 KB)) - 15:41, 14 January 2014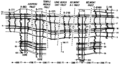
File:Geological-cross-sections fig2.png ...s irregular to make the cross section more compact. The left track of each log is an SP or gamma ray trace and the right track is a resistivity trace. (Fr(1,921 × 1,041 (171 KB)) - 15:32, 14 January 2014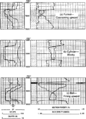
File:Quick-look-lithology-from-logs fig1.png ...the shale is least compacted. (b) Cylinder shape, blocky. Note that the SP log is featureless because the borehole salinity is the same as formation salin(945 × 1,311 (140 KB)) - 16:37, 14 January 2014
File:Standard-interpretation fig3.png Induction log for example interpretation.(949 × 1,255 (55 KB)) - 20:29, 14 January 2014
File:Standard-interpretation fig4.png Density-neutron log for example interpretation.(950 × 1,179 (45 KB)) - 20:29, 14 January 2014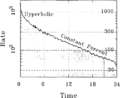
File:Production-histories fig1.png Semi-log decline history.(937 × 764 (32 KB)) - 17:29, 14 January 2014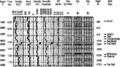
File:Synthetic-seismograms fig1.png Synthetic seismogram and associated well log data.(1,825 × 1,022 (80 KB)) - 20:46, 14 January 2014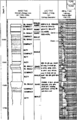
File:Measurement-while-drilling fig3.png Composite lithological log from MWD data. (From Schlumberger, 1989.)(956 × 1,487 (52 KB)) - 01:22, 14 January 2014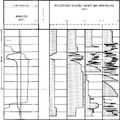
File:Wireline-formation-testers fig4.png ...ecord of a single pretest formation tester showing both analog and digital log presentations. Copyright: Western Atlas International, 1987</xref>; courtes(940 × 937 (73 KB)) - 21:44, 14 January 2014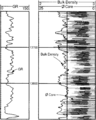
File:Core-log-transformations-and-porosity-permeability-relationships fig2.png Plot showing shitted core porosity, together with bulk density log.(931 × 1,163 (74 KB)) - 18:05, 14 January 2014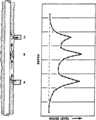
File:Production-logging fig2.png Noise log responses to fluid movement downhole.(943 × 1,177 (47 KB)) - 16:37, 14 January 2014
File:Guara 03.jpg Vertical log and section showing the fluvial facies of Guará Formation northern portion(1,299 × 891 (267 KB)) - 16:31, 24 June 2015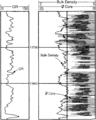
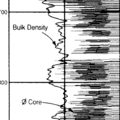
File:Core-log-transformations-and-porosity-permeability-relationships fig1.png ...owing unshifted core porosity in spiked format, together with bulk density log.(938 × 1,169 (73 KB)) - 18:05, 14 January 2014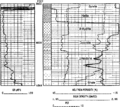
File:Quick-look-lithology-from-logs fig2.png Characteristic log signatures for a carbonate and evaporite sequence. Hole conditions are good(938 × 835 (28 KB)) - 16:37, 14 January 2014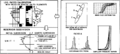
File:Reservoir-modeling-for-simulation-purposes fig3.png Log-facies calibration and determination of facies-related rock characteristics(1,960 × 886 (95 KB)) - 14:35, 14 January 2014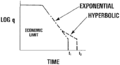
File:Reserves-estimation fig2.png Semi-log plot of rate of production versus time. (From IHRDC, 1982.)(905 × 493 (13 KB)) - 18:45, 14 January 2014


