Search results
Jump to navigation
Jump to search
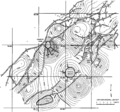
File:Subsurface-maps fig1.png Structure map of the top of the T5 marker, Frlo Formation, Brazoria County, Texas. (After Bebout et al., 1978.)(1,865 × 1,746 (308 KB)) - 20:42, 14 January 2014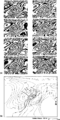
File:Three-dimensional-seismic-method fig2.png {{copyright|a marine 3-D survey and (b) a time-structure map of a marker horizon derived from the 3-D volume of migrated data. (Data courtesy of Wes ...e slices. Copyright: a marine 3-D survey and (b) a time-structure map of a marker horizon derived from the 3-D volume of migrated data. (Data courtesy of Wes(1,338 × 2,684 (369 KB)) - 19:36, 14 January 2014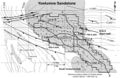
File:Mth14ch02f01.jpg Structure map of Yowlumne field drawn on the N-point marker, a regional correlation horizon that marks the approximate top of the Steve(700 × 457 (103 KB)) - 23:18, 3 December 2015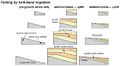
File:ST53Part01Pg12A.jpg ...e amount of fold growth that occurred subsequent to the deposition of that marker. As a result, younger horizons have narrower fold limbs than do older horiz(750 × 411 (83 KB)) - 16:36, 28 July 2015


