Search results
Jump to navigation
Jump to search
Page title matches
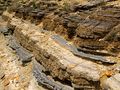
File:Oil-shale-Copy.jpg http://etv10news.com/first-commercial-oil-shale-mine-in-nation-to-be-housed-in-utah/(600 × 450 (198 KB)) - 20:40, 25 June 2014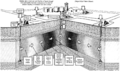
File:Enhanced-oil-recovery fig1.png (2,079 × 1,238 (1.51 MB)) - 01:49, 14 January 2014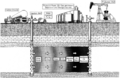
File:Enhanced-oil-recovery fig2.png Schematic diagram of carbon dioxide flooding. The viscosity of oil is reduced, providing more efficient miscible displacement. Copyright: U.S.(2,058 × 1,339 (1.4 MB)) - 01:49, 14 January 2014
File:Oil-field-production-geology.png (450 × 633 (553 KB)) - 18:24, 7 April 2014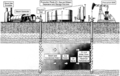
File:Enhanced-oil-recovery fig3.png ...c diagram of steam flooding. In this method, heat reduces the viscosity of oil and increases its mobility. Copyright: U.S. Department of Energy, Bartlesvi(1,996 × 1,269 (1.3 MB)) - 01:49, 14 January 2014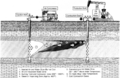
File:Enhanced-oil-recovery fig4.png Schematic diagram of <italic>in situ</italic> combustion. The mobility of oil is increased by reduced viscosity caused by heat and solution of combustion(1,999 × 1,300 (1.49 MB)) - 01:49, 14 January 2014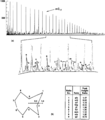
File:Oil-and-condensate-analysis fig5.png (1,942 × 2,226 (120 KB)) - 17:17, 14 January 2014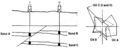
File:Oil-and-condensate-analysis fig6.png Gas chromatographic data can be used to determine oil reservoir continuity in conjunction with other methods such as pressure-dep(1,915 × 761 (52 KB)) - 17:17, 14 January 2014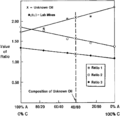
File:Oil-and-condensate-analysis fig7.png A binary mixing diagram showing how the relative proportions of an unknown oil can be determined using the two end-member oils (separate zones) and labora(941 × 909 (29 KB)) - 17:17, 14 January 2014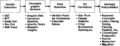
File:Oil-and-condensate-analysis fig1.png Flow diagram showing the basic steps followed in oil-oil correlations using gas chromatography.(1,954 × 747 (25 KB)) - 17:17, 14 January 2014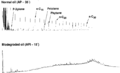
File:Oil-and-condensate-analysis fig2.png Gas chromatograms of a “normal” 35° API gravity oil and a biodegraded oil showing the lose of aliphatics (n-paraffins and isoprenoids) due to biodegr(1,924 × 1,166 (19 KB)) - 17:17, 14 January 2014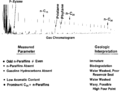
File:Oil-and-condensate-analysis fig3.png ...matography can be used to determine geological processes experienced by an oil.(1,917 × 1,448 (86 KB)) - 17:17, 14 January 2014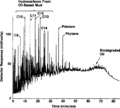
File:Oil-and-condensate-analysis fig4.png Gas chromatogram showing drilling mud contamination to a biodegraded oil.(931 × 837 (44 KB)) - 17:17, 14 January 2014
File:Exploring-for-oil-and-gas-traps.png (432 × 558 (109 KB)) - 13:56, 17 January 2014


Page text matches
File:Oil-and-condensate-analysis fig1.png Flow diagram showing the basic steps followed in oil-oil correlations using gas chromatography.(1,954 × 747 (25 KB)) - 17:17, 14 January 2014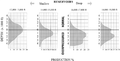
File:Evaluating-top-and-fault-seal fig10-46.png {{copyright|Oil & Gas Journal}} After Leach, 1993b. Copyright: Oil & Gas Journal.(1,653 × 837 (495 KB)) - 15:30, 31 January 2014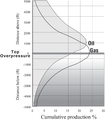
File:Evaluating-top-and-fault-seal fig10-45.png {{copyright|Oil & Gas Journal}} After Leach, 1993b. Copyright: Oil & Gas Journal.(1,270 × 1,454 (95 KB)) - 15:29, 31 January 2014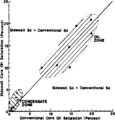
File:Overview-of-routine-core-analysis fig2.png ...il saturation values In sidewall and conventional cores may vary with such oil characteristics as API gravity.(945 × 983 (19 KB)) - 22:39, 13 January 2014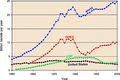
File:St54Ch3Figure19.jpg World yearly oil production from 1950 to 2002. Data as reported by the Oil & Gas Journal. FSU = former Soviet Union; OPEC = Organization of Petroleum(600 × 401 (84 KB)) - 20:17, 20 May 2014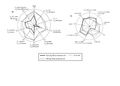
File:AlfraihAlSaifFigure7.jpg ...hatic hydrocarbons, b) aromatic hydrocarbons from oil inclusions and crude oil.(2,100 × 1,500 (487 KB)) - 19:15, 31 January 2022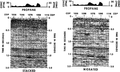
File:Surface-geochemical-exploration-for-petroleum fig18-6.png {{copyright|Rice, 1989; courtesy Oil & Gas Journal}} Modified. Copyright: Rice, 1989; courtesy Oil & Gas Journal.(1,612 × 961 (1.19 MB)) - 18:31, 18 January 2014File:Oil-and-condensate-analysis fig2.png Gas chromatograms of a “normal” 35° API gravity oil and a biodegraded oil showing the lose of aliphatics (n-paraffins and isoprenoids) due to biodegr(1,924 × 1,166 (19 KB)) - 17:17, 14 January 2014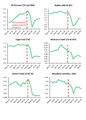
File:Figure2 2019-20 Comm Rept.jpg Status of major U.S. tight oil plays. Data source: U.S. EIA, U.S. Tight oil production report (all y-axis values in millions of bbls/day).(1,500 × 2,100 (517 KB)) - 18:57, 5 April 2021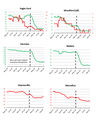
File:Figure4 2019-20 Comm Rept.jpg ...& gas plays: Rig counts over the last 12 months according to Baker Hughes (oil wells in green, gas wells in red); [[https://rigcount.bakerhughes.com/na-ri(1,500 × 1,875 (423 KB)) - 19:44, 5 April 2021
File:Migration-of-petroleum fig7-14.png {{copyright|McDowell (1975); courtesy Oil & Gas Journal}} . Copyright: McDowell (1975); courtesy Oil & Gas Journal.(974 × 1,324 (96 KB)) - 15:34, 28 January 2014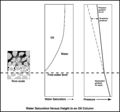
File:Mem91BuoyancyForcesFig26.jpg ...function of the balance of capillary forces pulling the water up from the oil-water interface and the force of gravity acting together with the density c(600 × 559 (38 KB)) - 17:36, 7 April 2014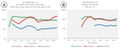
File:Figure5MancosCommRept.jpg ...onservation Division whereas the well on the right (B) is designated as an oil well.(1,320 × 556 (175 KB)) - 20:52, 14 April 2021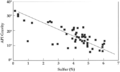
File:Oiloil-and-oilsource-rock-correlations fig8-2.png {{copyright|Kennicutt and Brooks (1988); courtesy Oil & Gas Journal}} . Copyright: Kennicutt and Brooks (1988); courtesy Oil & Gas Journal.(520 × 310 (14 KB)) - 16:37, 29 January 2014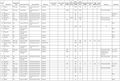
File:M106Ch12Table2b.jpg ...il (MMBO) and billions of cubic feet of gas (BCFG). Condensate included in oil volumes. Information mainly from Verma et al. (2004) and Jassim and Goff (2(700 × 474 (70 KB)) - 15:30, 12 May 2016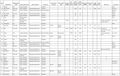
File:M106Ch12Table2.jpg ...il (MMBO) and billions of cubic feet of gas (BCFG). Condensate included in oil volumes. Information mainly from Verma et al. (2004) and Jassim and Goff (2(700 × 442 (69 KB)) - 15:28, 12 May 2016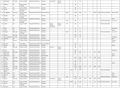
File:M106Ch12Table2a.jpg ...il (MMBO) and billions of cubic feet of gas (BCFG). Condensate included in oil volumes. Information mainly from Verma et al. (2004) and Jassim and Goff (2(700 × 515 (83 KB)) - 15:29, 12 May 2016
File:M106Ch12Table2c.jpg ...il (MMBO) and billions of cubic feet of gas (BCFG). Condensate included in oil volumes. Information mainly from Verma et al. (2004) and Jassim and Goff (2(700 × 489 (73 KB)) - 15:30, 12 May 2016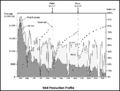
File:M91Ch6FG46.JPG ...g the water cut. From Shepherd, M., 2009, Sources of data, in M. Shepherd, Oil field production geology: AAPG Memoir 91, p. 49-63.(800 × 607 (60 KB)) - 17:17, 3 June 2015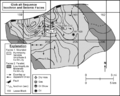
File:Sedimentary-basin-analysis fig4-46.png {{copyright|Springer-Verlag. Original map by Charles R. Beeman, Mobil Oil, 1987}} ...991). Copyright: Springer-Verlag. Original map by Charles R. Beeman, Mobil Oil, 1987.(1,330 × 1,063 (116 KB)) - 19:57, 30 January 2014


