Search results
Jump to navigation
Jump to search
There is a page named "Permeability" on this wiki. See also the other search results found.
Page title matches
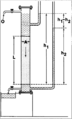
File:Permeability fig1.png (951 × 1,571 (48 KB)) - 18:02, 14 January 2014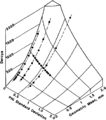
File:Permeability fig2.png Relationship among permeability, sorting, and grain size. (From Pettijohn, 1975; after Krumbein and Monk, 1(932 × 1,051 (22 KB)) - 18:02, 14 January 2014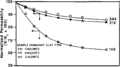
File:Permeability fig3.png Effect of net confining stress on permeability. (After Amaefule et al., 1988.)(939 × 527 (10 KB)) - 18:02, 14 January 2014
File:Permeability fig4.png (934 × 647 (32 KB)) - 18:02, 14 January 2014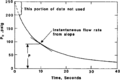
File:Permeability fig5.png (940 × 624 (22 KB)) - 18:02, 14 January 2014
File:Average permeability-Gluyas.jpg (405 × 324 (44 KB)) - 15:34, 30 June 2015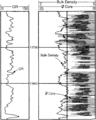
File:Core-log-transformations-and-porosity-permeability-relationships fig1.png (938 × 1,169 (73 KB)) - 18:05, 14 January 2014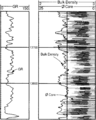
File:Core-log-transformations-and-porosity-permeability-relationships fig2.png (931 × 1,163 (74 KB)) - 18:05, 14 January 2014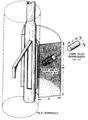
File:Core-log-transformations-and-porosity-permeability-relationships fig3.png (893 × 1,221 (82 KB)) - 18:05, 14 January 2014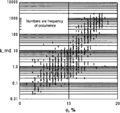
File:Core-log-transformations-and-porosity-permeability-relationships fig4.png Air permeability versus helium porosity from North Sea sandstone, conglomerate, and shale.(941 × 890 (53 KB)) - 18:06, 14 January 2014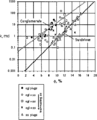
File:Core-log-transformations-and-porosity-permeability-relationships fig5.png Slip-corrected permeability (run under stress) versus helium porosity from McArthur River Field, Alaska(912 × 1,127 (19 KB)) - 18:06, 14 January 2014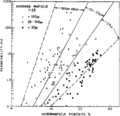
File:Core-log-transformations-and-porosity-permeability-relationships fig6.png Permeability versus porosity for various size groups in uniformly cemented nonvuggy rock(934 × 903 (17 KB)) - 18:06, 14 January 2014


Page text matches
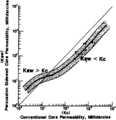
File:Overview-of-routine-core-analysis fig3.png ...formations with more than 20 md permeability consistently have a measured permeability that is lower than that from conventional analysis. (After Craft and Keelan(945 × 979 (46 KB)) - 22:39, 13 January 2014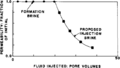
File:Rock-water-reaction-formation-damage fig1.png Liquid permeability test indicating permeability reduction due to rock-liquid reaction.(879 × 495 (8 KB)) - 19:18, 14 January 2014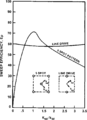
File:Waterflooding fig6.png ...ct of directional permeability on sweep efficiencies for varied degrees of permeability anisotropes at a fluid mobility ratio of 1. (From Landrum and Crawford, 196(944 × 1,299 (15 KB)) - 19:18, 14 January 2014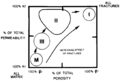
File:Evaluating-fractured-reservoirs fig1.png ...fracture porosity, <italic>k</italic><sub><italic>r</italic></sub>= matrix permeability, ϕ<sub><italic>r</italic></sub>= matrix porosity.(942 × 642 (23 KB)) - 15:00, 14 January 2014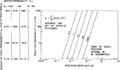
File:Evaluating-fractured-reservoirs fig3.png ...ures plotted as a function of fracture width, fracture spacing, and matrix permeability. Copyright: Nelson, 1985</xref>; courtesy of Gulf Publishing Co.(1,931 × 1,127 (80 KB)) - 15:00, 14 January 2014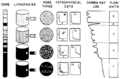
File:Flow-units-for-reservoir-characterization fig1.png ...ngle numbering system for identifying both obvious flow units and probable permeability barriers that can be mapped at the same scale as reservoir quality flow uni(1,487 × 976 (91 KB)) - 23:13, 14 January 2014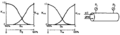
File:Fundamentals-of-fluid-flow fig3.png Two-phase relative permeability.(887 × 260 (6 KB)) - 01:52, 14 January 2014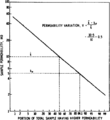
File:Waterflooding fig2.png Permeability variation example problem. (From Craig, 1971.)(941 × 1,027 (37 KB)) - 19:18, 14 January 2014File:Permeability fig3.png Effect of net confining stress on permeability. (After Amaefule et al., 1988.)(939 × 527 (10 KB)) - 18:02, 14 January 2014File:Core-log-transformations-and-porosity-permeability-relationships fig4.png Air permeability versus helium porosity from North Sea sandstone, conglomerate, and shale.(941 × 890 (53 KB)) - 18:06, 14 January 2014File:Core-log-transformations-and-porosity-permeability-relationships fig5.png Slip-corrected permeability (run under stress) versus helium porosity from McArthur River Field, Alaska(912 × 1,127 (19 KB)) - 18:06, 14 January 2014File:Core-log-transformations-and-porosity-permeability-relationships fig6.png Permeability versus porosity for various size groups in uniformly cemented nonvuggy rock(934 × 903 (17 KB)) - 18:06, 14 January 2014File:Permeability fig2.png Relationship among permeability, sorting, and grain size. (From Pettijohn, 1975; after Krumbein and Monk, 1(932 × 1,051 (22 KB)) - 18:02, 14 January 2014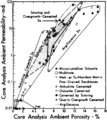
File:Evaluating-diagenetically-complex-reservoirs fig3.png Porosity-permeability semilog crosspiot with samples coded according to grain size, clay content,(920 × 1,033 (84 KB)) - 18:46, 14 January 2014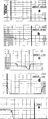
File:Wireline-formation-testers fig5.png Pretest pressure response to formation permeability as measured by a dual pretest tool. (From Smolen and Litsey, 1979.)(936 × 2,322 (54 KB)) - 21:44, 14 January 2014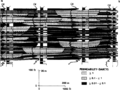
File:Geological-heterogeneities fig3.png Lateral and vertical bedding and permeability heterogeneity of a typical fluviodeltaic sequence. (From van de Graaff and(1,960 × 1,474 (237 KB)) - 15:34, 14 January 2014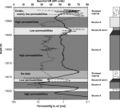
File:Mth14ch02f09.jpg ...nd slumped intervals. These variations result in the creation of reservoir permeability pathways that parallel bedding. From M. S. Clark, R. K. Prather, J. D. Melv(600 × 541 (60 KB)) - 20:21, 4 December 2015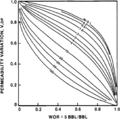
File:Waterflooding fig3.png Vertical sweep efficiency (coverage) as a function of WOR, ''M'', and permeability variation (''V''<sub>DP</sub>), where WOR = 5. (From Dystra and Parson, 195(949 × 944 (54 KB)) - 19:18, 14 January 2014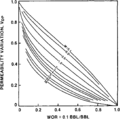
File:Waterflooding fig4.png Vertical sweep efficiency (coverage) as a function of WOR, ''M'', and permeability variation (''V''<sub>DP</sub>), where WOR = 0.1. (From Dystra and Parson, 1(937 × 927 (20 KB)) - 19:18, 14 January 2014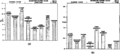
File:Evaluating-tight-gas-reservoirs fig3.png Histograms showing (a) average porosity values and (b) average permeability values for cored tight gas reservoir facies. (From Moslow and Tillman, 1989(1,964 × 879 (37 KB)) - 18:47, 14 January 2014


