Search results
Jump to navigation
Jump to search
Page title matches
File:Reservoir-quality fig1.png (950 × 868 (20 KB)) - 18:46, 14 January 2014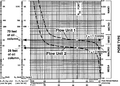
File:Predicting-reservoir-system-quality-and-performance fig9-20.png (1,346 × 963 (162 KB)) - 20:20, 31 January 2014
File:Predicting-reservoir-system-quality-and-performance fig9-52.png (1,111 × 484 (31 KB)) - 21:07, 31 January 2014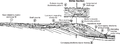
File:Predicting-reservoir-system-quality-and-performance fig9-84.png (1,984 × 722 (132 KB)) - 21:53, 31 January 2014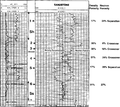
File:Predicting-reservoir-system-quality-and-performance fig9-30.png (1,612 × 1,440 (323 KB)) - 20:36, 31 January 2014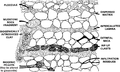
File:Predicting-reservoir-system-quality-and-performance fig9-63.png (1,483 × 895 (231 KB)) - 21:22, 31 January 2014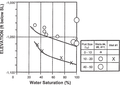
File:Predicting-reservoir-system-quality-and-performance fig9-95.png (1,207 × 856 (153 KB)) - 22:08, 31 January 2014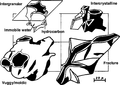
File:Predicting-reservoir-system-quality-and-performance fig9-9.png (1,277 × 901 (86 KB)) - 17:02, 31 January 2014
File:Predicting-reservoir-system-quality-and-performance fig9-42.png (1,396 × 1,153 (99 KB)) - 20:52, 31 January 2014
File:Predicting-reservoir-system-quality-and-performance fig9-74.png (1,681 × 1,119 (123 KB)) - 21:38, 31 January 2014
File:Predicting-reservoir-system-quality-and-performance fig9-21.png (1,100 × 739 (52 KB)) - 20:21, 31 January 2014
File:Predicting-reservoir-system-quality-and-performance fig9-53.png (1,060 × 430 (29 KB)) - 21:08, 31 January 2014
File:Predicting-reservoir-system-quality-and-performance fig9-85.png (962 × 722 (143 KB)) - 21:55, 31 January 2014
File:Predicting-reservoir-system-quality-and-performance fig9-32.png (1,144 × 1,075 (317 KB)) - 20:39, 31 January 2014
File:Predicting-reservoir-system-quality-and-performance fig9-64.png (1,229 × 981 (592 KB)) - 21:24, 31 January 2014
File:Predicting-reservoir-system-quality-and-performance fig9-96.png (1,057 × 1,017 (99 KB)) - 22:11, 31 January 2014
File:Predicting-reservoir-system-quality-and-performance fig9-10.png (847 × 761 (203 KB)) - 17:04, 31 January 2014
File:Predicting-reservoir-system-quality-and-performance fig9-43.png (1,340 × 979 (95 KB)) - 20:54, 31 January 2014
File:Predicting-reservoir-system-quality-and-performance fig9-75.png (1,658 × 1,324 (204 KB)) - 21:39, 31 January 2014
File:Predicting-reservoir-system-quality-and-performance fig9-22.png (1,616 × 760 (95 KB)) - 20:23, 31 January 2014


Page text matches
File:Reservoir-modeling-for-simulation-purposes fig2.png Analysis of core data for facies identification and rock quality assessment.(1,955 × 545 (75 KB)) - 14:35, 14 January 2014
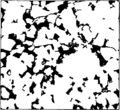
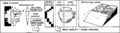
File:Thin-section-analysis fig1.png ...ypes in sandstones summarizing the influence of porosity type on reservoir quality. (Modified after Pittman, 1979.)(933 × 870 (15 KB)) - 21:07, 14 January 2014
File:Evaluating-tight-gas-reservoirs fig4.png Correlation of sedimentary facies and lithologies to petrographic reservoir quality. Distribution of reservoir facies in the subsurface Is compiled from observ(1,821 × 684 (21 KB)) - 18:47, 14 January 2014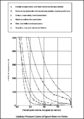
File:Mem91BuoyanceForcesFig27.jpg ...nger the plateau shown by the capillary curve, the better is the reservoir quality of the rock (from Sneider et al., 1977). Reprinted with permission from the(600 × 852 (64 KB)) - 17:18, 7 April 2014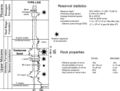
File:Mth14ch02f03.jpg ...ervoir statistics and rock properties of the Yowlumne Sandstone. Reservoir quality decreases from the axis of the fan eastward toward the fan margin. From M.(700 × 529 (75 KB)) - 15:26, 4 December 2015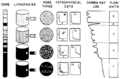
File:Flow-units-for-reservoir-characterization fig1.png ...le permeability barriers that can be mapped at the same scale as reservoir quality flow units.(1,487 × 976 (91 KB)) - 23:13, 14 January 2014


