Search results
Jump to navigation
Jump to search
There is a page named "Reservoir" on this wiki. See also the other search results found.
Page title matches
File:Reservoir-quality fig1.png (950 × 868 (20 KB)) - 18:46, 14 January 2014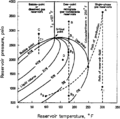
File:Petroleum-reservoir-fluid-properties fig1.png ...if reservoir temperature were less than 127 °F and <italic>gas</italic> if reservoir temperature were greater than 127°F. [[Category:Reservoir engineering methods]](932 × 924 (22 KB)) - 01:52, 14 January 2014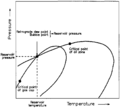
File:Petroleum-reservoir-fluid-properties fig2.png Pressure-temperature phase diagrams of gas cap and oil fluids in a reservoir that is Initially at saturated conditions. [[Category:Reservoir engineering methods]](952 × 853 (12 KB)) - 01:52, 14 January 2014
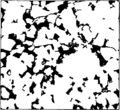
File:Comparison of reservoir rock types.jpg (470 × 286 (35 KB)) - 06:22, 30 June 2015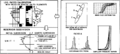
File:Reservoir-modeling-for-simulation-purposes fig3.png [[Category:Reservoir engineering methods]](1,960 × 886 (95 KB)) - 14:35, 14 January 2014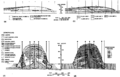
File:Flow-units-for-reservoir-characterization fig2.png ...and (d) reservoir facies (flow unit) subdivision of the Rainbow Lake reef reservoir (“A” Pool), Alberta, Canada. (Modified from Langston and Chin, 1968.)(2,737 × 1,751 (237 KB)) - 23:14, 14 January 2014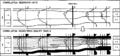
File:Reservoir-modeling-for-simulation-purposes fig4.png Correlation of reservoir units and subdivision of reservoir In flow units. [[Category:Reservoir engineering methods]](1,943 × 901 (33 KB)) - 14:35, 14 January 2014
File:Reservoir-modeling-for-simulation-purposes fig5.png Mapping of reservoir properties per grid block layer to provide input for the reservoir simulation. [[Category:Reservoir engineering methods]](1,770 × 545 (22 KB)) - 14:35, 14 January 2014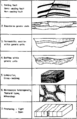
File:Reservoir-modeling-for-simulation-purposes fig1.png Classification of reservoir heterogeneity types. [[Category:Reservoir engineering methods]](946 × 1,466 (36 KB)) - 14:35, 14 January 2014
File:Reservoir-modeling-for-simulation-purposes fig2.png [[Category:Reservoir engineering methods]](1,955 × 545 (75 KB)) - 14:35, 14 January 2014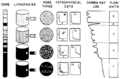
File:Flow-units-for-reservoir-characterization fig1.png ...and probable permeability barriers that can be mapped at the same scale as reservoir quality flow units.(1,487 × 976 (91 KB)) - 23:13, 14 January 2014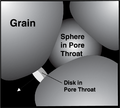
File:Predicting-reservoir-system-quality-and-performance fig9-10.png (847 × 761 (203 KB)) - 17:04, 31 January 2014
File:Predicting-reservoir-system-quality-and-performance fig9-43.png (1,340 × 979 (95 KB)) - 20:54, 31 January 2014
File:Predicting-reservoir-system-quality-and-performance fig9-75.png (1,658 × 1,324 (204 KB)) - 21:39, 31 January 2014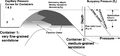
File:Predicting-reservoir-system-quality-and-performance fig9-22.png (1,616 × 760 (95 KB)) - 20:23, 31 January 2014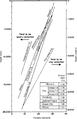
File:Predicting-reservoir-system-quality-and-performance fig9-54.png (929 × 1,437 (116 KB)) - 21:11, 31 January 2014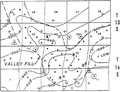
File:Predicting-reservoir-system-quality-and-performance fig9-86.png (977 × 745 (105 KB)) - 21:56, 31 January 2014
File:Predicting-reservoir-system-quality-and-performance fig9-33.png (2,000 × 1,403 (1.85 MB)) - 20:40, 31 January 2014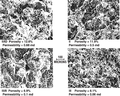
File:Predicting-reservoir-system-quality-and-performance fig9-65.png (1,216 × 968 (596 KB)) - 21:25, 31 January 2014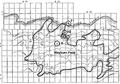
File:Predicting-reservoir-system-quality-and-performance fig9-97.png (1,658 × 1,158 (213 KB)) - 22:12, 31 January 2014


Page text matches
File:Petroleum-reservoir-fluid-properties fig1.png ...if reservoir temperature were less than 127 °F and <italic>gas</italic> if reservoir temperature were greater than 127°F. [[Category:Reservoir engineering methods]](932 × 924 (22 KB)) - 01:52, 14 January 2014File:Reservoir-modeling-for-simulation-purposes fig5.png Mapping of reservoir properties per grid block layer to provide input for the reservoir simulation. [[Category:Reservoir engineering methods]](1,770 × 545 (22 KB)) - 14:35, 14 January 2014File:Reservoir-modeling-for-simulation-purposes fig4.png Correlation of reservoir units and subdivision of reservoir In flow units. [[Category:Reservoir engineering methods]](1,943 × 901 (33 KB)) - 14:35, 14 January 2014File:Reservoir-modeling-for-simulation-purposes fig1.png Classification of reservoir heterogeneity types. [[Category:Reservoir engineering methods]](946 × 1,466 (36 KB)) - 14:35, 14 January 2014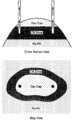
File:Drive-mechanisms-and-recovery fig6.png Combination drive reservoir. [[Category:Reservoir engineering methods]](911 × 1,499 (36 KB)) - 17:31, 19 December 2013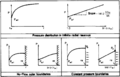
File:Fundamentals-of-fluid-flow fig4.png Pressure distribution in a radiai reservoir. [[Category:Reservoir engineering methods]](950 × 610 (32 KB)) - 01:52, 14 January 2014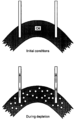
File:Drive-mechanisms-and-recovery fig3.png Solution gas drive reservoir. [[Category:Reservoir engineering methods]](840 × 1,342 (73 KB)) - 17:31, 19 December 2013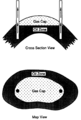
File:Drive-mechanisms-and-recovery fig4.png Gas cap drive reservoir. [[Category:Reservoir engineering methods]](859 × 1,275 (68 KB)) - 17:31, 19 December 2013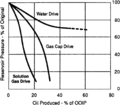
File:Drive-mechanisms-and-recovery fig1.png Reservoir pressure trends by drive mechanism. [[Category:Reservoir engineering methods]](947 × 825 (36 KB)) - 17:30, 19 December 2013File:Petroleum-reservoir-fluid-properties fig2.png Pressure-temperature phase diagrams of gas cap and oil fluids in a reservoir that is Initially at saturated conditions. [[Category:Reservoir engineering methods]](952 × 853 (12 KB)) - 01:52, 14 January 2014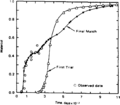
File:Conducting-a-reservoir-simulation-study-an-overview fig6.png Simulated water production for Initial and modified reservoir description. (From Mattax and Dalton, 1990; Copyright © 1990 Society of Pe [[Category:Reservoir engineering methods]](931 × 813 (29 KB)) - 18:46, 14 January 2014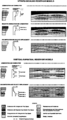
File:Carbonate-reservoir-models-facies-diagenesis-and-flow-characterization fig3.png ...r model and the subtidat-supratidal dolomitlzation and sulfate emplacement reservoir model.(1,424 × 2,558 (219 KB)) - 19:02, 13 January 2014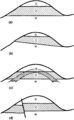
File:Fluid-contacts fig2.png ...rregular contacts due to semipermeable barrier in an otherwise homogeneous reservoir.(944 × 1,536 (55 KB)) - 01:51, 14 January 2014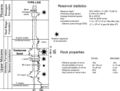
File:Mth14ch02f03.jpg ...rnia in AAPG Methods in Exploration No. 14: Horizontal Wells: Focus on the Reservoir, Edited by T. R. Carr, E. P. Mason, and C. T. Feazel.(700 × 529 (75 KB)) - 15:26, 4 December 2015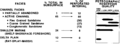
File:Evaluating-tight-gas-reservoirs fig4.png ...facies and lithologies to petrographic reservoir quality. Distribution of reservoir facies in the subsurface Is compiled from observations of cores, well logs,(1,821 × 684 (21 KB)) - 18:47, 14 January 2014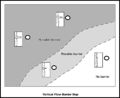
File:M91FG102.JPG ...eservoir. The degree to which individual barriers are effective across the reservoir can be characterized by vertical flow barrier maps.(800 × 653 (39 KB)) - 21:20, 12 August 2015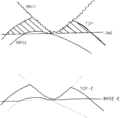
File:Using-and-improving-surface-models-built-by-computer fig23.png ...o define one grid for the top of reservoir and another for the base of the reservoir. These are subtracted to create the gross hydrocarbon rock thickness.(864 × 850 (21 KB)) - 22:33, 13 January 2014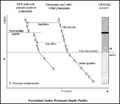
File:M91Ch06FG44.JPG ...d. Postproduction, formation tester data can give information on where the reservoir may be separating into zones of different pressures as a result of depletio(800 × 696 (58 KB)) - 17:11, 3 June 2015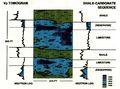
File:Cross-borehole-tomography-in-development-geology fig4.jpg ...s documenting stratigraphy and reservoir zones. Heterogeneity of the lower reservoir is documented by the contrast in log curves and the corresponding change in(1,945 × 1,441 (1.35 MB)) - 17:12, 15 January 2014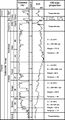
File:Mth14ch07f02.jpg ...125, in AAPG Methods in Exploration No. 14: Horizontal Wells: Focus on the Reservoir, Edited by T. R. Carr, E. P. Mason, and C. T. Feazel.(500 × 923 (106 KB)) - 17:50, 7 December 2015


