Search results
Jump to navigation
Jump to search
File:Log-analysis-applications fig5.png ...stant × formation water resistivity) and relates water saturation (<italic>S</italic><sub>w</sub>) to porosity and true resistivity.(929 × 801 (40 KB)) - 16:36, 14 January 2014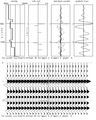
File:Interpreting-seismic-data fig12-7.png From software by S. Hill, Conoco.(1,430 × 1,789 (478 KB)) - 19:53, 17 January 2014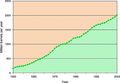
File:St54Ch3Figure21.jpg Volumes of the world's total natural-gas liquids production.(600 × 414 (65 KB)) - 21:54, 20 May 2014
File:AlAhmadiTawfiqFigure6.jpg ...ndensate Well Producing Below the Dew Point (Halim, A., Nuri, F., & Adi P, S. 2015).(737 × 474 (37 KB)) - 23:06, 9 November 2021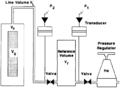
File:Porosity fig6.png Schematic diagram of Boyle's law helium porosimeter for grain volume measurement.(917 × 676 (30 KB)) - 18:19, 14 January 2014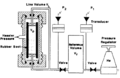
File:Porosity fig5.png Schematic diagram of a Boyle's law helium poroslmeter for pore volume measurement.(932 × 606 (36 KB)) - 18:19, 14 January 2014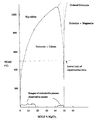
File:CN24FG2.jpg ...tions in the system CaCO<sub>3</sub> - MgCO<sub>3</sub>. From Land, Lyndon S., 1982, Dolomitization: AAPG Course Notes 24, p. 1-20.(626 × 781 (50 KB)) - 20:24, 15 July 2015
File:Updated lwandle3.svg {{PD-self}}{{Information | description = Lwandle plate and it's neighboring plates | source = Adobe Illustrator | date = 5 November 2014 |(537 × 746 (281 KB)) - 16:16, 20 November 2014
File:Updated lwandle4.jpg {{PD-self}}{{Information | description = Lwandle plate and it's neighboring plates | source = Adobe Illustrator | date = 5 November 2014 |(537 × 746 (105 KB)) - 17:22, 20 November 2014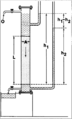
File:Permeability fig1.png Modified schematic diagram of Darcy's experimental apparatus. (Modified from Hubbert, 1953.)(951 × 1,571 (48 KB)) - 18:02, 14 January 2014
File:Stamps2008animated.pdf {{PD-self}}{{Information | description = Lwandle plate and it's relative velocities at the boundaries | source = Adobe Illustrator | date =(444 KB) - 16:19, 20 November 2014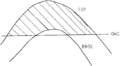
File:Using-and-improving-surface-models-built-by-computer fig21.png ...by grids representing the top and base of reservoir and the fluid contact(s).(881 × 484 (19 KB)) - 22:33, 13 January 2014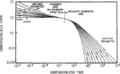
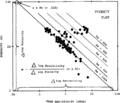
File:Pressure-transient-testing fig6.png Fetkovich's type curve for analyzing long-term production data. (After Fetkovich, 1980.(945 × 580 (43 KB)) - 18:23, 14 January 2014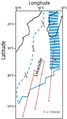
File:Stamps2008animatedX.jpg {{PD-self}}{{Information | description = Lwandle plate and it's relative velocities at plate boundaries | source = Adobe Illustrator | date(323 × 576 (66 KB)) - 17:27, 20 November 2014
File:About-taxes fig2.png ...hat remaining reserves (U) are end of year. In cost depletion calculation, S = sales during year. (After Thompson and Wright, 1985.)(922 × 1,325 (16 KB)) - 20:53, 14 January 2014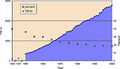
File:St54Figure46.JPG World hydroelectric power generation and percent of the world's total electricity generation. Figure 46 from Salvador, Amos, Energy-A Histo(600 × 344 (59 KB)) - 17:27, 30 June 2014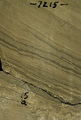
File:FG18CoreSt63Appendix3.JPG Core slab photo. From Ruppel, Stephen C., 2012, Appendix 3, in S. C. Ruppel, ed., Anatomy of a giant carbonate reservoir: Fullerton Clear Fo(600 × 890 (315 KB)) - 16:10, 29 June 2015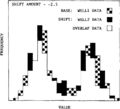
File:Log-analysis-applications fig7.png ...re data interactively from one well to another by shifting the second well's data across the base well on the screen. A visual best fit is usually satis(925 × 838 (28 KB)) - 16:36, 14 January 2014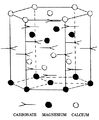
File:CN24FG1.jpg ...es, and the alternation of calcium and magnesium planes. From Land, Lyndon S., 1982, Dolomitization: AAPG Course Notes 24, p. 1-20.(590 × 715 (71 KB)) - 20:14, 15 July 2015
File:MainPageFG18CoreSt63Appendix3.jpg Core slab photo. From Ruppel, Stephen C., 2012, Appendix 3, in S. C. Ruppel, ed., Anatomy of a giant carbonate reservoir: Fullerton Clear Fo(400 × 400 (104 KB)) - 16:14, 29 June 2015


