Search results
Jump to navigation
Jump to search
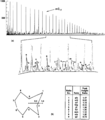
File:Oil-and-condensate-analysis fig5.png ...tions, (b) as star diagrams of selected peak height ratios, or (c) as data tables of peak height ratios. The star diagram is a polar plot of the peak height(1,942 × 2,226 (120 KB)) - 17:17, 14 January 2014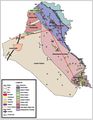
File:M106Ch12Fig03.jpg ...nd significant wells with oil and/or gas shows are shown; numbers refer to Tables 1–5 in [[Iraq petroleum geology]]. Red lines are approximate locations of(700 × 902 (78 KB)) - 13:57, 12 May 2016

