Search results
Jump to navigation
Jump to search
Page title matches
File:Pressure-transient-testing fig10.png (933 × 1,300 (39 KB)) - 18:23, 14 January 2014
File:Pressure-transient-testing fig11.png (942 × 1,142 (45 KB)) - 18:23, 14 January 2014
File:Pressure-transient-testing fig1.png (1,932 × 1,245 (42 KB)) - 18:23, 14 January 2014
File:Pressure-transient-testing fig2.png (1,946 × 591 (34 KB)) - 18:23, 14 January 2014
File:Pressure-transient-testing fig3.png (934 × 536 (9 KB)) - 18:23, 14 January 2014
File:Pressure-transient-testing fig4.png (945 × 759 (11 KB)) - 18:23, 14 January 2014
File:Pressure-transient-testing fig5.png (1,955 × 806 (48 KB)) - 18:23, 14 January 2014
File:Pressure-transient-testing fig6.png (945 × 580 (43 KB)) - 18:23, 14 January 2014
File:Pressure-transient-testing fig7.png (937 × 573 (43 KB)) - 18:23, 14 January 2014
File:Pressure-transient-testing fig8.png (934 × 669 (29 KB)) - 18:23, 14 January 2014
File:Pressure-transient-testing fig9.png (915 × 589 (17 KB)) - 18:23, 14 January 2014
Page text matches
File:M91Ch13FG83.JPG ...pressure builds up with time, and this effect can be detected by pressure transient analysis. From Shepherd, M., 2009, Structural geology: Faults, in M. Shephe(600 × 749 (49 KB)) - 21:16, 29 April 2015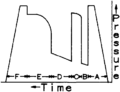
File:Drill-stem-testing fig6.png ...ct chart. Gauges inside above and outside below the closing tool. Pressure transient analysis done from these gauges. (A) Run in hole, gauge measuring hydrostat(724 × 556 (6 KB)) - 22:25, 14 January 2014

