Search results
Jump to navigation
Jump to search
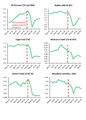
File:Figure2 2019-20 Comm Rept.jpg ...ht oil plays. Data source: U.S. EIA, U.S. Tight oil production report (all y-axis values in millions of bbls/day).(1,500 × 2,100 (517 KB)) - 18:57, 5 April 2021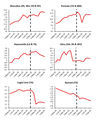
File:Figure3 2019-20 Comm Rept.jpg ...ht gas plays. Data source: U.S. EIA, U.S. Tight gas production report (all y-axis values in billions of scf/day).(1,500 × 1,875 (495 KB)) - 19:34, 5 April 2021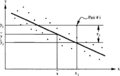
File:Correlation-and-regression-analysis fig1.png Linear regression of ''x''-on-''y''. Note the negative slope corresponding to a negative correlation. The reg(942 × 598 (16 KB)) - 18:39, 14 January 2014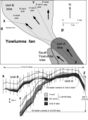
File:Mth14ch02f05.jpg Map with cross sections X-Z and Y-Z showing basinward-stepping geometries exhibited by lobe-shaped sand bodie(500 × 682 (64 KB)) - 17:07, 4 December 2015


