Borehole gravity
| Development Geology Reference Manual | |

| |
| Series | Methods in Exploration |
|---|---|
| Part | Geophysical methods |
| Chapter | Borehole gravity |
| Author | Alan T. Herring |
| Link | Web page |
| Store | AAPG Store |
Basic concepts

The borehole gravity meter (BHGM) can be described simply as a deep-investigating density logging tool. Applications range beyond this simple description to include detection of oil- and gas-filled porosity and detection and definition of remote structures, such as salt domes, faults, and reefs.
One of the great advantages of the BHGM is that it is the only logging method that can directly measure density at a significant distance away from a well. It is also the only logging method that can reliably obtain density through well casing.Cite error: Invalid <ref> tag; invalid names, e.g. too many It is practically unaffected by near-borehole influences, which are the scourge of nuclear tools: casing, poor cement bonding, rugosity, washouts, and fluid invasion. Another advantage is the fundamental simplicity of the relationships among gravity, mass, rock volume, and density. Complex geology can be easily modeled so that the response of a range of hypothetical models can be studied and understood before undertaking a survey.
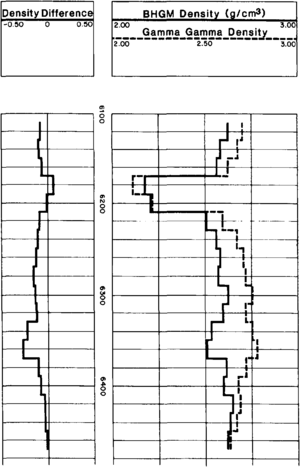
What is actually measured is referred to as BHGM apparent density, which is a simple function of the measured vertical gradient of gravity. To obtain an apparent density measurement, gravity is measured at two depths. The accuracy of the computed density depends on the accuracy of both measured differences: gravity and depth. Operationally, BHGM surveys resemble vertical seismic profiling (VSP) surveys. The BHGM is stopped at each planned survey level, and a 5- to 10-min reading is taken. The blocky appearance of the log reflects the station interval (Figure 1).
The log is not continuous. BHGM measurements are taken at discrete depths usually at intervals of 10 to length::50 ft, depending on the resolution required. While the BHGM has remarkable resolution in the measurement of density over intervals of length::10 ft or more (less than 0.01 g/cm3), surveys requiring closer vertical resolution must sacrifice density resolution.
Applications
The spectrum of BHGM applications is defined on one extreme by density logging and on the other by remote sensing of structure. The first extreme sometimes focuses strictly on formation and reservoir evaluation questions, while the other extends to basic exploration. Figure 1 is an example of both applications. In fact, the purpose of the survey was to detect carbonate porosity in a reef environment that was missed by the other logs. For this objective, the useful radius of investigation of the measurement is on the order of length::50 ft. The sharp negative density anomaly observed between 6330 and depth::6370 ft suggests porosity obscured by near-borehole effects or poor volume sampling. However, the broad departure of the BHGM and gamma-gamma logs over the depth range of the logged section is typical of a structural effect, in this case the edge of the reef complex which is within a few hundred feet.For more information about this log and for more examples of applications, see Borehole gravity applications: examples.
Density logging
Borehole gravity density measurements are unhindered by casing, poor hole conditions, and all but the deepest fluid invasion. The BHGM measurement samples a large volume of rock, which provides a density-porosity value that is more representative of the formation. This is especially beneficial in carbonate and fractured reservoirs.[1] BHGM surveys have been used to find hydrocarbon-filled porosity missed by other logs in both open and cased holes. Gas-saturated sands are a particularly easy target.[2]
The wide radius of investigation has also been successfully used to determine gas-oil and oil-water contacts in reservoirs where other measurements have been ineffective.[3][4] BHGM density measurements have been used to calculate hydrocarbon saturations: the larger the fluid density contrast, the larger the measured effect. Gas saturations are therefore the easiest to measure. The difference in densities measured by the gamma-gamma log and the BHGM can be used to calculate the difference in oil saturation between the invaded and undisturbed zones, which can in turn give an estimate of movable hydrocarbons.
Remote sensing
A useful and practical rule of thumb for BHGM remote sensing applications is that a remote body with sufficient density contrast can be detected by the BHGM no farther from the wellbore than one or two times the height of the body. A salt dome with depth::15,000 ft of vertical relief would have a definitive signature a few miles away. A channel sand length::20 ft thick would be detectable no more than length::40 ft away. Local geology, and in particular the thickness of local density units, defines the effective radius of investigation of the BHGM.
Computer modeling of BHGM measurements can be used to develop relatively detailed salt dome flank or reef flank model interpretations. Modeling is particularly effective where seismic data can be integrated into the modeling process; a model is sought that is consistent with both data sets.[5]
Theory
Measurements of gravity differences repeatable to about 3 μGals have been achieved using a LaCoste and Romberg borehole gravity meter. The unit “Gal” is named after Galileo, and 1 Gal = 1 cm/sec2. The earth's gravity field varies from about 979 Gals at the equator to 983 Gals at the poles. Thus, 1 μGal is about one part in 109 of the earth's field. The BHGM is clearly a remarkably sensitive instrument.
The underlying assumption in computing apparent density is based on an earth model made up of a layer cake of infinite horizontal slabs. For such a model, the density of any slab is exactly given by the gravity gradient through that slab. The gradient measured at any point within the slab is constant, and the slabs above and below it have no effect on the gradient within it. This simple assumption serves effectively in a majority of cases. Modeling of more complex geometries is not difficult and is routinely used in computing structural corrections to apparent density.
The formula for apparent density is given approximately by the following equation (there are also small corrections for latitude and elevation);
where
- ρ = density (in g/cm3)
- Δz = depth interval (in ft)
- Δg = change in gravity (in (μGals)
The constant density term compensates for the earth's normal vertical gravity gradient.
Operating limitations
The gravity meter itself is a delicate spring balance that measures changes in weight of a small proof mass. The meter must be leveled at each station, and it is accurately thermostatted at a temperature of about 126°C. The present LaCoste and Romberg meter cannot operate in a wellbore deviated from vertical by more than 14°. Table 1 shows a summary of maximum operating conditions for the meter.
| Sonde Diameter | Conditions | |
|---|---|---|
| Temperature | temperature::115°C | temperature::260°C |
| Pressure | 12,000 psi | 20,000 psi |
| Deviation | 14° | 14° |
For operating temperatures higher than temperature::126°C, the meter is operated inside a Dewar flask. Using the flask, operating temperatures up to temperature::260°C are possible. Operations from floating platforms are also possible and have been carried out. An operating limitation is the platform motion noise transmitted down the cable to the BHGM. Because of this noise, readings shallower than about depth::4000 ft are usually not possible without some form of downhole tool clamp.
See also
- Borehole gravity: uses, advantages, and disadvantages
- Borehole gravity tool
- Borehole gravity applications: examples
References
- ↑ Rasmussen, N. F., 1975, The successful use of the borehole gravity meter in Northern Michigan: The Log Analyst, v. 16, n. 5, p. 3–10.
- ↑ Gournay, L. S., and R. E. Maute, 1982, Detection of bypassed gas using borehole gravimeter and pulsed neutron capture logs: The Log Analyst, v. 23, n. 3, p. 27–32.
- ↑ van Popta, J., 1990, Use of Borehole gravimetry for reservoir characterization and fluid saturation monitoring: Society of Petroleum Engineers, SPE 20896.
- ↑ Schultz, A. K., 1989, Monitoring fluid movement with the Borehole gravity meter: Geophysics, v. 54, n. 10, p. 1267–1273, 10, 1190/1, 1442586
- ↑ Lines, L. R., A. K. Schultz, S. Treitel, 1988, Cooperative inversion of geophysical data: Geophysics, v. 53, n. 1, p. 820, 10, 1190/1, 1442403
