Borehole gravity tool
| Exploring for Oil and Gas Traps | |

| |
| Series | Treatise in Petroleum Geology |
|---|---|
| Part | Predicting the occurrence of oil and gas traps |
| Chapter | Applying gravity in petroleum exploration |
| Author | David A. Chapin, Mark E. Ander |
| Link | Web page |
| Store | AAPG Store |
How the tool measures gravity[edit]

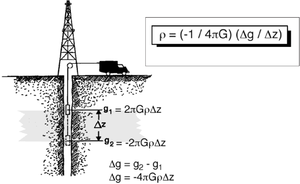
Figure 1 illustrates the fundamentals of measuring density using a borehole gravity sensor. Two gravity measurements, g1 and g2, are made downhole, separated in depth by Δz. The value G is the universal gravity constant. Thus, the gravity gradient, Δg/Δz, is related directly to the density of the intervening layer. The result is a direct computation of the bulk density of that layer.
Depth of investigation[edit]

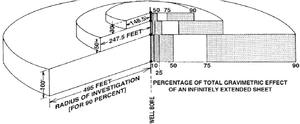
Figure 2 shows how the depth of investigation is tunable by means of varying the separation between two gravity measurements, Δz. The rule of thumb is that 90% of the gravity effect can be imaged at a distance away from the borehole within five times Δz.
Depth of investigation of various logging methods[edit]
The following table, based on data from Beyer[3] shows conservative estimates of the depth of investigation using various density logging tools. Borehole gravity can sample the farthest distance and investigate the most formation.
| Logging Method | Radial Distance for 90% Effect, in | Radial Distance for 90% Effect, cm | Formation Volume Investigated, ft3 | Formation Volume Investigated, m3 |
|---|---|---|---|---|
| Conventional 5.25-in. (13-cm) core | 2.6 | 6.6 | 1.5 | 0.04 |
| Gamma-gamma log | 8 | 20 | 17 | 0.5 |
| Neutron log | 14 | 36 | 40 | 1.1 |
| Sonic log | 18 | 46 | 59 | 1.7 |
| Borehole gravity log | 600 | 1,500 | 78,532 | 2,224 |
Logging procedure[edit]
In a typical logging operation, several downhole station locations are planned ahead of time. The tool is fitted to a conventional wireline and lowered to each station. Once the tool is stopped (in some wells it must be clamped to the side of the well), the measurement begins. The gravity values are telemetered to an operator at the surface. Because of vibrations, seismic activity, or residual tool movement, the measurements may take some time to settle to an acceptable noise level.
Tool limitations[edit]
There are three major problems with the present tool.
- It is large. The smallest typical configuration is 4⅛″ OD, but more widely used configurations are up to 5¼″.
- Because the sensor must be set to vertical to make a reading, it can only measure in wells of 14° deviation or less.
- It takes a long time to make measurements, and it is not a continuous logging tool. The wireline must stop at each individual station, and the tool takes an average of 5–15 min per station for a reading. This means a typical borehole gravity logging operation can run from 24 to 48 hrs.
For the most part, these problems are engineering limitations of the present tool that could be overcome with new and modern sensor development. There is an active project underway to redesign the present tool to make it more useful in modern wells.
See also[edit]
- Borehole gravity methods
- Borehole gravity: uses, advantages, and disadvantages
- Borehole gravity applications: examples
- Borehole gravity
References[edit]
- ↑ Schowalter, T. T., 1979, Mechanics of secondary hydrocarbon migration and entrapment: AAPG Bulletin, vol. 63, no. 5, p. 723–760.
- ↑ McCulloh, T. H., J. R. Kandle, J. E. Schoellhamer, 1968, Application of gravity measurements in wells to problems of reservoir evaluation: Transactions of the 9th Annual SPWLA Logging Symposium. Fundamental work describing the distance of sources seen by the borehole gravity meter.
- ↑ Beyer, L. A., 1991, Borehole gravity Surveys: SEG Short Course notes, June, 350 p.