Age model chart
| It has been suggested that this article be merged with [[::Sea level cycle|sea level cycle]]. (Discuss) |
| Exploring for Oil and Gas Traps | |

| |
| Series | Treatise in Petroleum Geology |
|---|---|
| Part | Critical elements of the petroleum system |
| Chapter | Sedimentary basin analysis |
| Author | John M. Armentrout |
| Link | Web page |
| Store | AAPG Store |
What is an age model?[edit]
Detailed correlation of depositional sequences and the calculation of maturation and timing of generation vs. trap formation requires an age model for the stratigraphy of a study area. An age model is a chart showing the chronostratigraphic relationship of different depositional sequences and associated formations within a study area. Integration of biostratigraphy and depositional sequences and their correlation to a global geologic time scale provides such an age model. Using this age model to calibrate each depositional sequence lets us calculate geologic rates, such as rates of rock accumulation and burial and thermal heating rates of the stratigraphic section.
Construction[edit]
The list below outlines the procedure for constructing an age model.
- Construct a depositional sequence chart for the study area. Use all available depositional sequence and biostratigraphic data.
- Normalize all available sequence charts for the basin, including the study area sequence chart, to the same time scale using the bioevent marker taxa or zonal assemblages.
- Make a sum of sequences curve by integrating the depositional sequence chart for the study area with the other sequence charts for the basin.
- Calibrate the sum of sequences curve to a global time scale using global biostratigraphic zones, magnetostratigraphic polarity scales, oxygen isotope chronology, and global sea level cycle charts.
Example[edit]
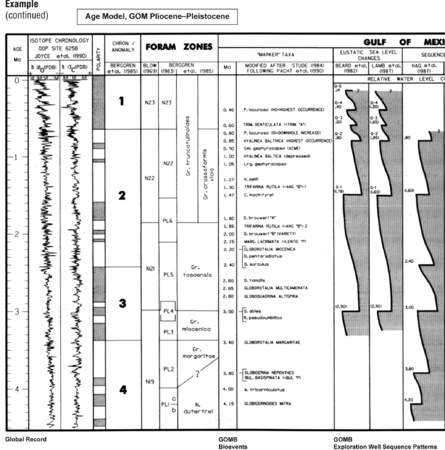
Figure 1 Composite chronostratigraphic chart that serves as an age model for the GOM basin Pliocene and Pleistocene, summarizing nine studies published between 1982 and 1993. From Armentrout[1]; courtesy The Geological Society, London.
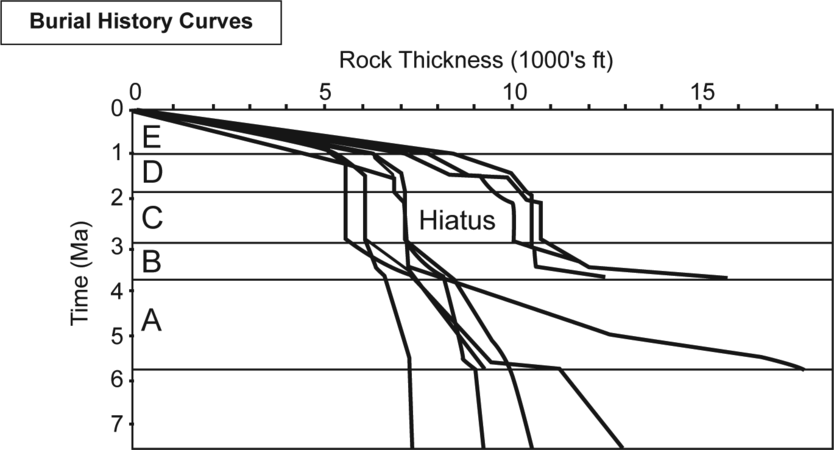
Figure 3 Rock thickness vs. time plot for nine key wells south of east- ern Louisiana within the area of the 6–4 Ma depocenter. After Piggott and Pulham;[5] courtesy Gulf Coast SEPM.
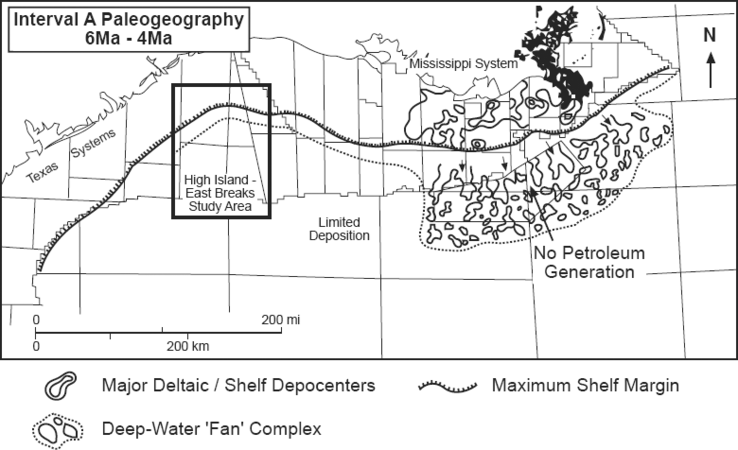
Figure 4 Paleogeography of the Mississippi River depositional system from approximately 6 Ma to 4 Ma. After Piggott and Pulham;[5] courtesy Gulf Coast Section SEPM.


Constructing depositional cycle charts for the GOM basin extends back to at least Kolb and Van Lopik[6] and Frasier[7] with Beard et al.[8] demonstrating the link between depositional sequences and glacial eustasy. Figure 1 is a composite chronostratigraphic chart that serves as an age model for the GOM basin Pliocene and Pleistocene, summarizing nine studies published between 1982 and 1993. The local cycle charts from each of these studies have been calibrated to the same time scale using the same bioevent marker taxa and are in turn correlated to the global foraminiferal zones and magnetostratigraphic polarity scale as defined by Berggren et al.[9] and the oxygen isotope chronology of Joyce et al.[10] The resulting sum of the depositional sequences and their associated condensed sections[11][12][13] are illustrated.
The composite of all the local studies appears under the column Sum of Sequences, three of which occur in only one or two studies and are considered to be local and possibly autocyclic events (locally forced redistribution of sediments). The youngest six cycles of the chart occur between the Pseudoemiliani lacunosa bioevent (0.8 Ma) and the sea floor (0.0 Ma) and average 130,000 years in duration. The ten older cycles were deposited between Globigerinoides mitra (4.15 Ma) and P. lacunosa (0.8 Ma) bioevents and average 330,000 years duration. These 16 cycles are interpreted as regionally significant and allocyclic (forced by changes external to the sedimentary unit). They are probably glacioeustatic cycles. (See Figure 2 and accompanying discussion.)
Using this age model to calibrate each depositional cycle helps us calculate geologic rates, such as rates of rock accumulation and burial and thermal heating rates of the stratigraphic section.
Figure 3 shows a rock thickness vs. time plot for nine key wells south of eastern Louisiana within the area of the 6-4 Ma depocenter (Figure 4; see also Fiduk and Behrens.)[14] Each major depositional interval is characterized by changes in depositional rates from oldest to youngest, in large part due to the geographic shifting of depositional centers. Dating within the wells is based on key biostratigraphic marker species for the deep-water environments of the GOM basin. Interval B is characterized by high rates of sedimentation associated with abundant gravity-flow sand deposition. It is followed by interval C, characterized by slow sedimentation and deposition of regionally effective top seal.
Example of modeling oil generation[edit]
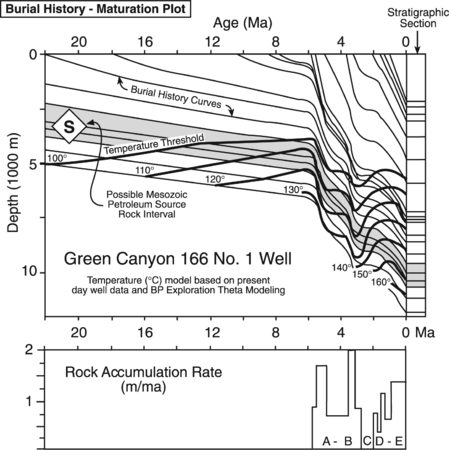
Figure 5 Rock accumulation rates for the Green Canyon 166 No. 1 well as a histogram (lower graph) and as a set of burial history curves (upper graph). After Piggott and Pulham;[5] courtesy Gulf Coast SEPM.
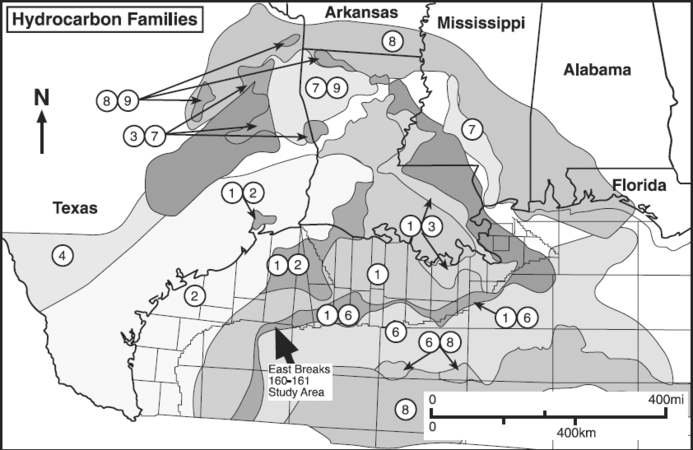
Figure 6 Map of hydrocarbon types based on analyses of more than 2000 oil, 600 gas, and 1200 seep samples correlated to specific source rocks. Modified from Gross et al.[15]


Figure 5 shows the rock accumulation rates for the Green Canyon 166 No. 1 well as a histogram (lower graph) and as a set of burial history curves (upper graph). Using temperature data from exploration wells, Piggott and Pulham.[5] calculated temperature thresholds for the accumulated stratigraphic section. Burial of potential marine source rock above a temperature of approximately temperature::100°C could initiate generation of oil.
The dominant hydrocarbon type in the Green Canyon area is associated with hydrocarbon family 6 (Figure 6), suggesting a Jurassic source rock. This source rock is indicated by the diamond labeled S and the shaded stratigraphic intervals. Based on the calculation of Piggott and Pulham[5]), using BP Exploration's Theta Modeling, generation of significant oil from a Jurassic source rock may have begun approximately 6 Ma in the Green Canyon 166 No. 1 well area when the Jurassic source rock was buried below depth::5000 m and above a temperature of temperature::120°C, the threshold for significant oil generation (see “Petroleum systems”).
These calculations of rock accumulation and source rock maturation rates are dependent on good age models. Biostratigraphic data are the primary correlation tools in the GOM basin, as in most basins. Considerable care must be used in correlating basin bioevents to the global geologic time scale. The methodology for and problem of such correlations are discussed in Armentrout and Clement[16] and Armentrout[17][1]
See also[edit]
- Sea level cycle phase
- Determining sea level cycle order
- Sea level cycle phase and systems tracts
- Systems tracts identification
- Systems tracts and trap types
- Identifying sea level cycle phase with biostratigraphy
- Biofacies and changing sea level
- Superimposed sea level cycles
References[edit]
- ↑ 1.0 1.1 Armentrout, J. M., 1996, High-resolution sequence biostratigraphy: examples from the Gulf of Mexico Plio–Pleistocene, in J. Howell and J. Aiken, eds., High Resolution Sequence stratigraphy: Innovations and Applications: The Geological Society of London Special Publication 104, p. 65–86.
- ↑ Haq, B., J. Hardenbol, and P. R. Vail, 1988, Mesozoic and Cenozoic chronostratigraphy and cycles of sea-level change: SEPM Special Publication 42, p. 71–108.
- ↑ Williams, D. F., and D. M. Trainor, 1987, Integrated chemical stratigraphy of deep- water frontier areas of the northern Gulf of Mexico: Proceedings, Gulf Coast Section SEPM 8th Annual Research Conference, p. 151–158.
- ↑ Armentrout, J. M., 1993, Relative seal-level variations and fault-salt response: offshore Texas examples: Proceedings, Gulf Coast Section SEPM 14th Annual Research Confer- ence, p. 1–7.
- ↑ 5.0 5.1 5.2 5.3 5.4 Piggott, N., and A. Pulham, 1993, Sedimentation rate as the control on hydrocarbon sourcing, generation, and migration in the deepwater Gulf of Mexico: Proceedings, Gulf Coast Section SEPM 14th Annual Research conference, p. 179–191.
- ↑ Kolb, C. R., and J. R. Van Lopik, 1958, Geology of the Mississippi River deltaic plain, southeastern Louisiana: U., S. Army Engineer Waterway Experiment Station, Corps of Engineers, Vicksburg, MS, Technical Report 3-483, 120 p.
- ↑ Frasier, D. E., 1974, Depositional episodes: their relationship to the Quaternary stratigraphic framework in the north-western portion of the Gulf basin: University of Texas at Austin, Bureau of Economic Geology Circular 74-1.
- ↑ Beard, J. H., J. B. Sangree, and L. A. Smith, 1982, Quaternary chronology, paleoclimate, depositional sequences, and eustatic cycles: AAPG Bulletin, vol. 66, p. 158–169.
- ↑ Berggren, W. A., D. V. Kent, and J. A. Van Couvering, 1985, The Neogene: part 2. Neogene geochronology and chronostratigraphy in Snelling, N. J., ed., The Chronology of the Geologic Record: Blackwell Scientific Publishing and Geological Society of London Memoir 10, p. 211–260.
- ↑ Joyce, J. E., L. R. C. Tjalsma, and J. M. Prutzman, 1990, High-resolution planktic stable isotope record and spectral analysis for the last 5., 35 myr: ODP site 625 northeast Gulf of Mexico: Paleoceanography, vol. 5, p. 507–529.
- ↑ Shaffer, B. L., 1987a, The potential of calcareous nannofossils for recognizing Plio–Pleistocene climatic cycles and sequence boundaries on the shelf: Proceedings, Gulf Coast Section SEPM 8th Annual Research Conference, p. 142–145.
- ↑ Shaffer, B. L., 1987b, The nature and significance of condensed sections in Gulf Coast late Neogene sequence stratigraphy: Gulf Coast Assoc. of Geological Societies and Gulf Coast Section SEPM Transactions, vol. 40, p. 767–776.
- ↑ Pacht, J. A., B. E. Bowen, J. H. Bearn, and B. L Schaffer, 1990, Sequence stratigraphy of Plio–Pleistocene depositional facies in the offshore Louisiana south additions: Gulf Coast Assoc. of Geological Societies Transactions, vol. 40, p. 1–18.
- ↑ Fiduk, J. C., and E. W. Behrens, 1993, A comparison of Plio-Pleistocene to Recent sediment accumulation rates in the East Breaks area, northwestern Gulf of Mexico: Proceedings, Gulf Coast Section SEPM 14th Annual Research conference, p. 41–55.
- ↑ Gross, O. P., K. C. Hood, L. M. Wenger, and S. C. Harrison, 1995, Seismic imaging and analysis of source and migration within an integrated hydrocarbon system study, northern Gulf of Mexico basin: Abstracts, 1st Latin American Geophysical Conference, p. 1–4.
- ↑ Armentrout, J., M., Clement, J., F., 1990, Biostratigraphic calibration of depositional cycles: a case study in High Island–Galveston–East Breaks areas, offshore Texas: Proceedings, Gulf Coast Section SEPM 11th Annual Research Conference, p. 21–51.
- ↑ Armentrout, J. M., 1991, Paleontological constraints on depositional modeling: examples of integration of biostratigraphy and seismic stratigraphy, Pliocene–Pleistocene, Gulf of Mexico, in P. Weimer, and M. H. Lin, eds., Seismic Facies and Sedimentary Processes of Submarine Fans and Turbidite Systems: New York, Springer-Verlag, p. 137–170.
External links[edit]
| find literature about Age model chart |